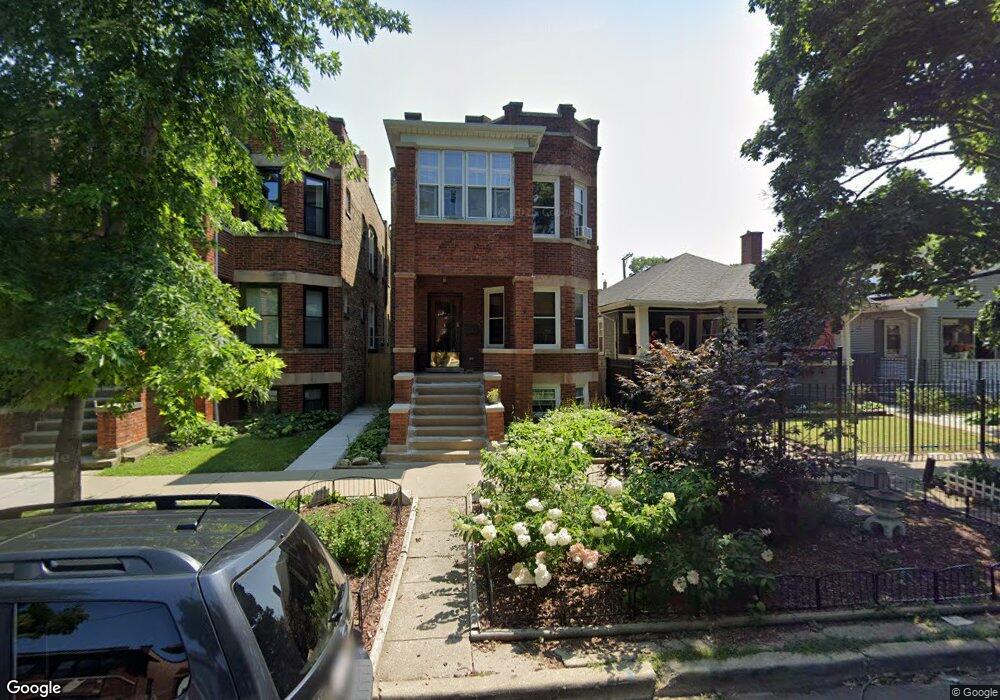
3323 W Cullom Ave Unit 2 Chicago, IL 60618
Irving Park NeighborhoodEstimated Value: $539,000 - $624,000
4
Beds
2
Baths
2,046
Sq Ft
$281/Sq Ft
Est. Value
About This Home
This home is located at 3323 W Cullom Ave Unit 2, Chicago, IL 60618 and is currently estimated at $575,786, approximately $281 per square foot. 3323 W Cullom Ave Unit 2 is a home located in Cook County with nearby schools including Henry Elementary School, Roosevelt High School, and CICS Irving Park.
Ownership History
Date
Name
Owned For
Owner Type
Purchase Details
Closed on
Feb 13, 2019
Sold by
Easton Nancy L and Bestow Robert W
Bought by
Easton Nancy L and Bestow Robert W
Current Estimated Value
Purchase Details
Closed on
Nov 9, 2018
Sold by
Scott John
Bought by
Easton Nancy L and Bestow Robert W
Home Financials for this Owner
Home Financials are based on the most recent Mortgage that was taken out on this home.
Original Mortgage
$303,750
Outstanding Balance
$267,627
Interest Rate
4.9%
Mortgage Type
New Conventional
Estimated Equity
$308,159
Purchase Details
Closed on
Apr 9, 1998
Sold by
Hoeffner Hans G and Hoeffner Elisabeth
Bought by
Monger Matthew M and Monger Mary B
Home Financials for this Owner
Home Financials are based on the most recent Mortgage that was taken out on this home.
Original Mortgage
$168,150
Interest Rate
7.26%
Mortgage Type
Commercial
Create a Home Valuation Report for This Property
The Home Valuation Report is an in-depth analysis detailing your home's value as well as a comparison with similar homes in the area
Home Values in the Area
Average Home Value in this Area
Purchase History
| Date | Buyer | Sale Price | Title Company |
|---|---|---|---|
| Easton Nancy L | -- | None Available | |
| Easton Nancy L | $405,000 | Chicago Title | |
| Monger Matthew M | $177,000 | -- |
Source: Public Records
Mortgage History
| Date | Status | Borrower | Loan Amount |
|---|---|---|---|
| Open | Easton Nancy L | $303,750 | |
| Previous Owner | Monger Matthew M | $168,150 |
Source: Public Records
Tax History Compared to Growth
Tax History
| Year | Tax Paid | Tax Assessment Tax Assessment Total Assessment is a certain percentage of the fair market value that is determined by local assessors to be the total taxable value of land and additions on the property. | Land | Improvement |
|---|---|---|---|---|
| 2024 | $7,206 | $47,000 | $19,220 | $27,780 |
| 2023 | $7,551 | $40,000 | $15,500 | $24,500 |
| 2022 | $7,551 | $40,000 | $15,500 | $24,500 |
| 2021 | $7,398 | $40,000 | $15,500 | $24,500 |
| 2020 | $5,589 | $28,104 | $6,820 | $21,284 |
| 2019 | $6,438 | $31,937 | $6,820 | $25,117 |
| 2018 | $5,648 | $31,937 | $6,820 | $25,117 |
| 2017 | $5,901 | $30,698 | $6,200 | $24,498 |
| 2016 | $5,667 | $30,698 | $6,200 | $24,498 |
| 2015 | $5,163 | $30,698 | $6,200 | $24,498 |
| 2014 | $4,458 | $26,507 | $5,580 | $20,927 |
| 2013 | $4,359 | $26,507 | $5,580 | $20,927 |
Source: Public Records
Map
Nearby Homes
- 4246 N Kimball Ave
- 4248 N Sawyer Ave
- 4322 N Kimball Ave
- 3247 W Berteau Ave
- 3222 W Berteau Ave Unit 2
- 4231 N Kedzie Ave Unit 3E
- 4231 N Kedzie Ave Unit 4C
- 4207 N Drake Ave
- 4116 N Kedzie Ave
- 4143 N Drake Ave
- 4438 N Spaulding Ave
- 4445 N Kimball Ave Unit 2
- 4307 N Troy St Unit 1
- 4026 N Kimball Ave
- 4249 N Central Park Ave
- 4333 N Troy St Unit 3E
- 4046 N Saint Louis Ave
- 4438 N Kedzie Ave Unit G-1
- 4505 N Bernard St
- 4310 N Central Park Ave
- 3323 W Cullom Ave
- 3321 W Cullom Ave
- 3325 W Cullom Ave
- 3319 W Cullom Ave Unit 1
- 3319 W Cullom Ave
- 3329 W Cullom Ave
- 3315 W Cullom Ave Unit 1
- 3315 W Cullom Ave Unit G
- 3315 W Cullom Ave Unit 2
- 3315 W Cullom Ave
- 3311 W Cullom Ave
- 3339 W Cullom Ave Unit 1
- 3339 W Cullom Ave
- 3337 W Cullom Ave
- 3337 W Cullom Ave Unit 3
- 3320 W Cullom Ave
- 3320 W Cullom Ave
- 3309 W Cullom Ave Unit GN
- 3309 W Cullom Ave Unit 1
- 3309 W Cullom Ave Unit 2