3324 Helen St Savannah, GA 31404
Sunset Park NeighborhoodEstimated Value: $301,000 - $335,000
5
Beds
2
Baths
2,392
Sq Ft
$133/Sq Ft
Est. Value
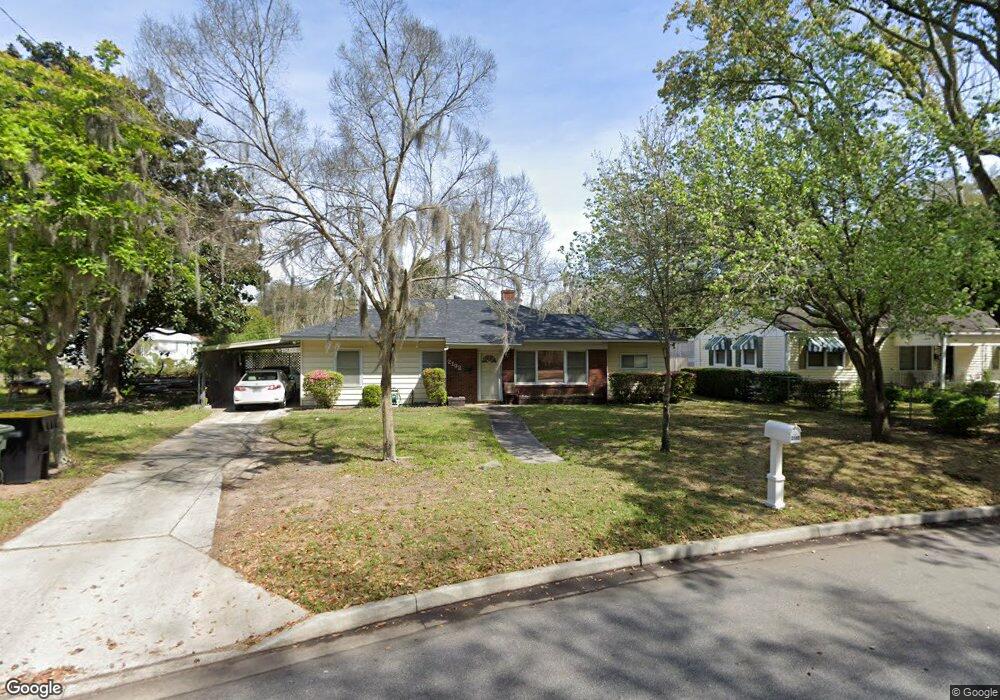
About This Home
This home is located at 3324 Helen St, Savannah, GA 31404 and is currently estimated at $316,948, approximately $132 per square foot. 3324 Helen St is a home located in Chatham County with nearby schools including Myers Middle School, Johnson High School, and The Habersham School.
Ownership History
Date
Name
Owned For
Owner Type
Purchase Details
Closed on
Sep 19, 2019
Sold by
Green Cora B
Bought by
Gogo Investments Llc
Current Estimated Value
Home Financials for this Owner
Home Financials are based on the most recent Mortgage that was taken out on this home.
Original Mortgage
$118,042
Outstanding Balance
$103,182
Interest Rate
3.5%
Mortgage Type
New Conventional
Estimated Equity
$213,766
Purchase Details
Closed on
Sep 12, 2019
Sold by
Gogo Investments Llc
Bought by
Pekelder Shawn
Home Financials for this Owner
Home Financials are based on the most recent Mortgage that was taken out on this home.
Original Mortgage
$118,042
Outstanding Balance
$103,182
Interest Rate
3.5%
Mortgage Type
New Conventional
Estimated Equity
$213,766
Purchase Details
Closed on
Dec 5, 2014
Sold by
Cunningham Darryl
Bought by
Mcleod Wendy
Purchase Details
Closed on
Jan 26, 2010
Sold by
Green Cora B
Bought by
Lesene Shaneeka Cunningham
Create a Home Valuation Report for This Property
The Home Valuation Report is an in-depth analysis detailing your home's value as well as a comparison with similar homes in the area
Home Values in the Area
Average Home Value in this Area
Purchase History
| Date | Buyer | Sale Price | Title Company |
|---|---|---|---|
| Gogo Investments Llc | $73,561 | -- | |
| Pekelder Shawn | $114,000 | -- | |
| Mcleod Wendy | -- | -- | |
| Lesene Shaneeka Cunningham | -- | -- |
Source: Public Records
Mortgage History
| Date | Status | Borrower | Loan Amount |
|---|---|---|---|
| Open | Gogo Investments Llc | $118,042 |
Source: Public Records
Tax History Compared to Growth
Tax History
| Year | Tax Paid | Tax Assessment Tax Assessment Total Assessment is a certain percentage of the fair market value that is determined by local assessors to be the total taxable value of land and additions on the property. | Land | Improvement |
|---|---|---|---|---|
| 2025 | $2,464 | $130,280 | $38,880 | $91,400 |
| 2024 | $2,464 | $80,840 | $12,480 | $68,360 |
| 2023 | $933 | $76,480 | $12,480 | $64,000 |
| 2022 | $867 | $71,080 | $7,800 | $63,280 |
| 2021 | $3,029 | $51,360 | $7,800 | $43,560 |
| 2020 | $1,407 | $45,600 | $5,960 | $39,640 |
| 2019 | $1,719 | $44,560 | $7,800 | $36,760 |
| 2018 | $2,096 | $46,600 | $16,200 | $30,400 |
| 2017 | $1,729 | $41,440 | $22,800 | $18,640 |
| 2016 | $1,211 | $41,520 | $22,800 | $18,720 |
| 2015 | $1,748 | $41,920 | $22,840 | $19,080 |
| 2014 | $2,375 | $42,800 | $0 | $0 |
Source: Public Records
Map
Nearby Homes
- 3303 Hazel St
- 2004 N Fernwood Dr
- 2118 N Fernwood Dr
- 3313 Martha St
- 2024 E 51st St
- 46 S Parkwood Dr
- 55 S Parkwood Dr
- 3314 April St
- 0 Coakley St Unit 10272641
- 0 Coakley St Unit 153953
- 2214 Shell Rd
- 2110 E 56th St
- 2338 Lorraine Dr
- 2309 Lorraine Dr
- 2009 E 57th St
- 2044 E 60th St
- 3209 Woodlawn Dr
- 1918 E 63rd St
- 3110 Wright Ave
- 4903 La Roche Ave
- 3318 Helen St
- 2118 Country Dr
- 2104 N Fernwood Dr
- 2102 N Fernwood Dr
- 3312 Helen St
- 2106 N Fernwood Dr
- 3319 Helen St
- 2108 N Fernwood Dr
- 3308 Helen St
- 2008 N Fernwood Dr
- 2112 Country Dr
- 3330 Hazel St
- 3323 Hazel St
- 3319 Hazel St
- 3317 Hazel St
- 2110 N Fernwood Dr
- 2101 N Fernwood Dr
- 2006 N Fernwood Dr
- 3304 Helen St
- 2110 Country Dr