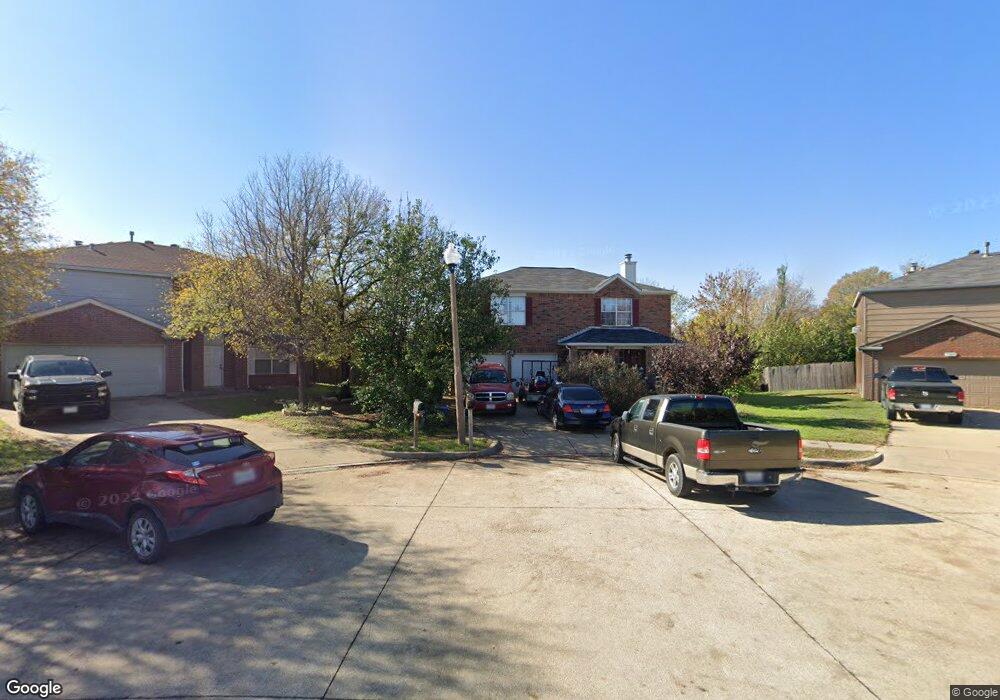
3324 Teasbend Ct Denton, TX 76210
South Denton NeighborhoodEstimated Value: $321,027 - $380,000
4
Beds
3
Baths
2,395
Sq Ft
$145/Sq Ft
Est. Value
About This Home
This home is located at 3324 Teasbend Ct, Denton, TX 76210 and is currently estimated at $346,757, approximately $144 per square foot. 3324 Teasbend Ct is a home located in Denton County with nearby schools including Ryan Elementary School, McMath Middle School, and Denton High School.
Ownership History
Date
Name
Owned For
Owner Type
Purchase Details
Closed on
Aug 25, 2011
Sold by
Wenaco One L L C
Bought by
Chachere Donovan E
Current Estimated Value
Home Financials for this Owner
Home Financials are based on the most recent Mortgage that was taken out on this home.
Original Mortgage
$129,158
Outstanding Balance
$90,352
Interest Rate
4.87%
Mortgage Type
FHA
Estimated Equity
$256,405
Purchase Details
Closed on
Jan 25, 2008
Sold by
Monaco Thomas O
Bought by
Wenaco One Llc
Purchase Details
Closed on
Jan 31, 2003
Sold by
Hud
Bought by
Wenaco One Llc
Purchase Details
Closed on
Oct 1, 2002
Sold by
Mortgage Electronic Registration Systems
Bought by
Hud
Purchase Details
Closed on
Oct 5, 2001
Sold by
Pulte Homes Of Texas Lp
Bought by
Mccommas Brian A
Home Financials for this Owner
Home Financials are based on the most recent Mortgage that was taken out on this home.
Original Mortgage
$143,876
Interest Rate
6.84%
Mortgage Type
FHA
Create a Home Valuation Report for This Property
The Home Valuation Report is an in-depth analysis detailing your home's value as well as a comparison with similar homes in the area
Home Values in the Area
Average Home Value in this Area
Purchase History
| Date | Buyer | Sale Price | Title Company |
|---|---|---|---|
| Chachere Donovan E | -- | Stewart | |
| Wenaco One Llc | -- | Fidelity Title | |
| Wenaco One Llc | -- | -- | |
| Wenaco One Llc | -- | -- | |
| Hud | -- | -- | |
| Hud | -- | -- | |
| Mccommas Brian A | -- | -- |
Source: Public Records
Mortgage History
| Date | Status | Borrower | Loan Amount |
|---|---|---|---|
| Open | Chachere Donovan E | $129,158 | |
| Previous Owner | Mccommas Brian A | $143,876 |
Source: Public Records
Tax History
| Year | Tax Paid | Tax Assessment Tax Assessment Total Assessment is a certain percentage of the fair market value that is determined by local assessors to be the total taxable value of land and additions on the property. | Land | Improvement |
|---|---|---|---|---|
| 2025 | $6,066 | $359,566 | $72,354 | $287,212 |
| 2024 | $7,261 | $376,186 | $72,354 | $303,832 |
| 2023 | $7,594 | $397,707 | $72,354 | $325,353 |
| 2022 | $6,847 | $322,530 | $72,354 | $250,176 |
| 2021 | $5,482 | $246,588 | $44,678 | $201,910 |
| 2020 | $5,593 | $244,688 | $44,678 | $200,010 |
| 2019 | $5,713 | $239,418 | $44,678 | $194,740 |
| 2018 | $5,196 | $215,093 | $44,678 | $170,415 |
| 2017 | $4,954 | $200,419 | $44,678 | $155,741 |
| 2016 | $4,841 | $177,539 | $31,913 | $145,626 |
| 2015 | $3,681 | $158,929 | $31,913 | $127,016 |
| 2014 | $3,681 | $147,136 | $31,913 | $115,223 |
| 2013 | -- | $132,833 | $25,530 | $107,303 |
Source: Public Records
Map
Nearby Homes
- 3304 Teasbend Ct
- 3117 Kappwood Ct
- 1108 Central Village Dr
- 3109 Pecan Tree Dr
- 400 Saratoga Dr
- 2916 Tamarack Ln
- 2808 Tamarack Ln
- 2704 Tamarack Ln
- 2620 Tamarack Ln
- 4521 Remuda Ln
- 2616 Tamarack Ln
- 2612 Tamarack Ln
- 2608 Tamarack Ln
- 301 Fairmount Ct
- 3309 Del Mar Dr
- 5100 Edge Way
- 409 Meadowlands Dr
- 5108 Edge Way
- 5204 Middlestone Ln
- 3200 Belmont St
- 3320 Teasbend Ct
- 3321 Teasbend Ct
- 3317 Teasbend Ct
- 3316 Teasbend Ct
- 3313 Teasbend Ct
- 3312 Teasbend Ct
- 3320 Bentgate Ct
- 3324 Bentgate Ct
- 3309 Teasbend Ct
- 3308 Teasbend Ct
- 3316 Bentgate Ct
- 3312 Bentgate Ct
- 3305 Teasbend Ct
- 3308 Bentgate Ct
- 3329 Bentgate Ct
- 3300 Teasbend Ct
- 3301 Teasbend Ct
- 3304 Bentgate Ct
- 3300 Bentgate Ct
- 3325 Bentgate Ct
Your Personal Tour Guide
Ask me questions while you tour the home.