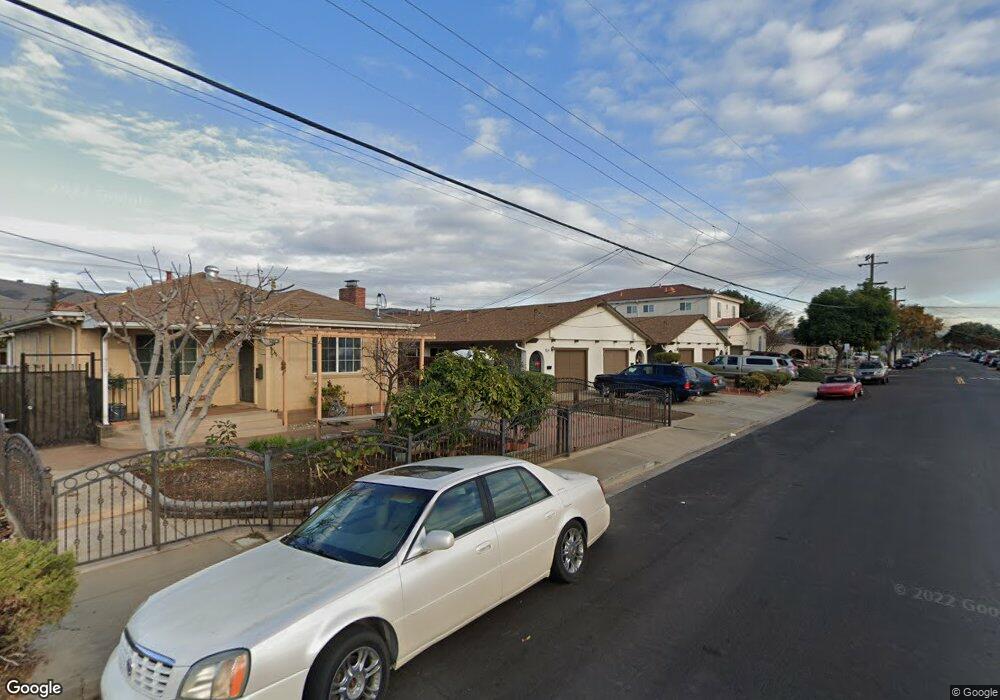
33244 9th St Union City, CA 94587
Downtown Union City NeighborhoodEstimated Value: $911,000 - $1,120,000
4
Beds
2
Baths
1,782
Sq Ft
$544/Sq Ft
Est. Value
About This Home
This home is located at 33244 9th St, Union City, CA 94587 and is currently estimated at $968,625, approximately $543 per square foot. 33244 9th St is a home located in Alameda County with nearby schools including Hillview Crest Elementary School, Cesar Chavez Middle School, and James Logan High School.
Ownership History
Date
Name
Owned For
Owner Type
Purchase Details
Closed on
Aug 31, 2019
Sold by
Martin Donald C and Martin Marina H
Bought by
Martin Donald C and Martin Marina H
Current Estimated Value
Purchase Details
Closed on
Jun 22, 2010
Sold by
Martin Donald Cassidy
Bought by
Martin Donald C and Mrtin Marina H
Purchase Details
Closed on
Jan 8, 2009
Sold by
Martin Donald and Martin Rita S
Bought by
Martin Donald Cassidy and Thomasson Amanda Lynn Martin
Purchase Details
Closed on
Dec 1, 2008
Sold by
Martin Donald and Martin Rita S
Bought by
Martin Donald Cassidy and Thomasson Amanda Lynn Martin
Purchase Details
Closed on
Jan 13, 2007
Sold by
Martin Donald and Martin Rita S
Bought by
Martin Donald Cassidy and Thomasson Amanda Lynn Martin
Purchase Details
Closed on
Aug 16, 2006
Sold by
Martin Donald and Martin Rita S
Bought by
Martin Donald Cassidy and Thomasson Amanda Lynn Martin
Purchase Details
Closed on
Dec 29, 2005
Sold by
Martin Donald and Martin Rita S
Bought by
Martin Donald and Martin Rita S
Create a Home Valuation Report for This Property
The Home Valuation Report is an in-depth analysis detailing your home's value as well as a comparison with similar homes in the area
Home Values in the Area
Average Home Value in this Area
Purchase History
| Date | Buyer | Sale Price | Title Company |
|---|---|---|---|
| Martin Donald C | -- | None Available | |
| Martin Donald C | -- | None Available | |
| Martin Donald Cassidy | -- | None Available | |
| Martin Donald Cassidy | -- | None Available | |
| Martin Donald Cassidy | -- | None Available | |
| Martin Donald Cassidy | -- | None Available | |
| Martin Donald | -- | None Available |
Source: Public Records
Tax History
| Year | Tax Paid | Tax Assessment Tax Assessment Total Assessment is a certain percentage of the fair market value that is determined by local assessors to be the total taxable value of land and additions on the property. | Land | Improvement |
|---|---|---|---|---|
| 2025 | $4,508 | $123,604 | $8,086 | $115,518 |
| 2024 | $4,508 | $121,180 | $7,927 | $113,253 |
| 2023 | $4,224 | $118,804 | $7,772 | $111,032 |
| 2022 | $4,077 | $116,474 | $7,619 | $108,855 |
| 2021 | $3,976 | $114,191 | $7,470 | $106,721 |
| 2020 | $3,888 | $113,020 | $7,393 | $105,627 |
| 2019 | $3,898 | $110,804 | $7,248 | $103,556 |
| 2018 | $3,794 | $108,632 | $7,106 | $101,526 |
| 2017 | $3,696 | $106,502 | $6,967 | $99,535 |
| 2016 | $3,583 | $104,414 | $6,830 | $97,584 |
| 2015 | $3,491 | $102,846 | $6,728 | $96,118 |
| 2014 | $3,371 | $100,832 | $6,596 | $94,236 |
Source: Public Records
Map
Nearby Homes
- 1085 La Brea Terrace
- 33545 9th St
- 1013 Montoya Terrace Unit 5
- 33359 University Dr
- 33528 13th St
- 33638 9th St
- 33603 3rd St
- 137 Tamarack Dr
- 33721 12th St
- 33834 9th St
- 33840 10th St
- 1729 Sherman Dr
- 33848 10th St
- 33853 10th St
- 113 Lafayette Ave
- 31953 Potsdam St
- 2038 Hartnell St
- 32613 Singh Cir
- 31518 Medinah St
- 2623 Copa Del Oro Dr
Your Personal Tour Guide
Ask me questions while you tour the home.