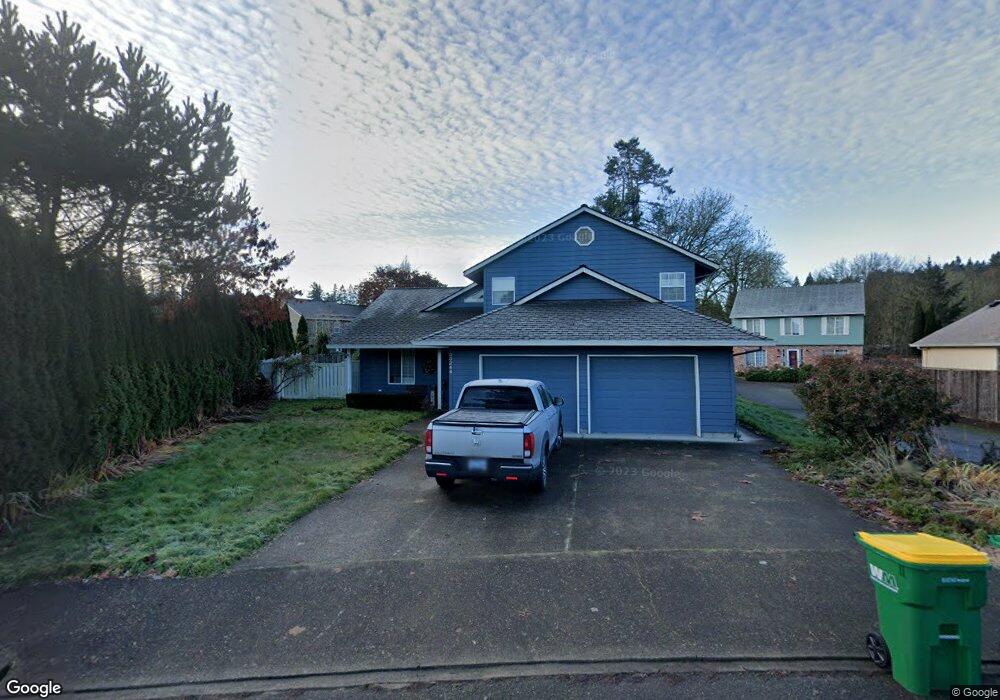
33244 SW Park Dr Scappoose, OR 97056
Estimated Value: $517,016 - $533,000
3
Beds
2
Baths
1,684
Sq Ft
$311/Sq Ft
Est. Value
About This Home
This home is located at 33244 SW Park Dr, Scappoose, OR 97056 and is currently estimated at $523,504, approximately $310 per square foot. 33244 SW Park Dr is a home located in Columbia County with nearby schools including Scappoose High School and Scappoose Adventist School.
Ownership History
Date
Name
Owned For
Owner Type
Purchase Details
Closed on
Jun 10, 2020
Sold by
Alexander John Randle
Bought by
Alexander Jesse H
Current Estimated Value
Home Financials for this Owner
Home Financials are based on the most recent Mortgage that was taken out on this home.
Original Mortgage
$367,500
Outstanding Balance
$324,317
Interest Rate
3.2%
Mortgage Type
New Conventional
Estimated Equity
$199,187
Purchase Details
Closed on
Apr 19, 2005
Sold by
Brandt Cynthia L
Bought by
Alexander John Randle
Home Financials for this Owner
Home Financials are based on the most recent Mortgage that was taken out on this home.
Original Mortgage
$219,100
Interest Rate
5.84%
Mortgage Type
Unknown
Purchase Details
Closed on
Aug 23, 2004
Sold by
Tompkins Gary B and Tompkins Carol A
Bought by
Brandt Cynthia L
Home Financials for this Owner
Home Financials are based on the most recent Mortgage that was taken out on this home.
Original Mortgage
$185,000
Interest Rate
5.95%
Mortgage Type
Stand Alone First
Create a Home Valuation Report for This Property
The Home Valuation Report is an in-depth analysis detailing your home's value as well as a comparison with similar homes in the area
Home Values in the Area
Average Home Value in this Area
Purchase History
| Date | Buyer | Sale Price | Title Company |
|---|---|---|---|
| Alexander Jesse H | $363,825 | First American | |
| Alexander John Randle | $273,900 | Ticor Title | |
| Brandt Cynthia L | $255,000 | Ticor Title |
Source: Public Records
Mortgage History
| Date | Status | Borrower | Loan Amount |
|---|---|---|---|
| Open | Alexander Jesse H | $367,500 | |
| Previous Owner | Alexander John Randle | $219,100 | |
| Previous Owner | Brandt Cynthia L | $185,000 | |
| Closed | Alexander John Randle | $27,350 |
Source: Public Records
Tax History Compared to Growth
Tax History
| Year | Tax Paid | Tax Assessment Tax Assessment Total Assessment is a certain percentage of the fair market value that is determined by local assessors to be the total taxable value of land and additions on the property. | Land | Improvement |
|---|---|---|---|---|
| 2025 | $5,560 | $337,690 | $118,980 | $218,710 |
| 2024 | $5,406 | $327,860 | $115,510 | $212,350 |
| 2023 | $5,356 | $318,320 | $116,520 | $201,800 |
| 2022 | $5,130 | $309,050 | $112,360 | $196,690 |
| 2021 | $4,983 | $300,050 | $116,550 | $183,500 |
| 2020 | $4,622 | $291,320 | $114,950 | $176,370 |
| 2019 | $4,501 | $282,840 | $110,580 | $172,260 |
| 2018 | $4,398 | $274,610 | $118,660 | $155,950 |
| 2017 | $4,319 | $266,620 | $115,200 | $151,420 |
| 2016 | $4,264 | $258,860 | $111,840 | $147,020 |
| 2015 | $3,947 | $251,230 | $96,900 | $154,330 |
| 2014 | $3,998 | $251,330 | $81,430 | $169,900 |
Source: Public Records
Map
Nearby Homes
- 33344 SW Rokin Way
- 33370 SW Rokin Way
- 33358 SW Rokin Way
- 33363 SW Rokin Way
- 33375 SW Rokin Way
- 51925 Columbia River Hwy
- 33298 SW Meadowbrook Dr
- 32922 Coal Creek Rd
- 33279 SW Havlik Dr
- 33410 Meadowbrook Dr
- 51557 SW Em Watts Rd
- 51692 SE 3rd St
- 32839 SW Crystal Springs Ct
- 32898 SW Keys Landing Way
- 51350 SW Randstad St
- 51540 SE Westlake Dr Unit 56
- 33321 SW Holland Dr
- 51459 SE Westlake Dr Unit 102
- 33102 Felisha Way
- 52171 Casswell Dr
- 51871 SW Creekview Place
- 51869 SW Creekview Place
- 33251 Linden St
- 33261 Linden St
- 51870 SW Creekview Place
- 51875 SW Creekview Place
- 33241 Linden St
- 33271 Linden St
- 51881 SW Creekview Place
- 33257 SW Park Dr
- 33283 Linden St
- 51880 SW Creekview Place
- 33278 SW Park Dr
- 51877 SW Creekview Place
- 33231 Linden St
- 51855 SW 4th St
- 51889 SW Creekview Place
- 51851 SW 4th St
- 33260 Linden St
- 33246 Linden St