
Seller's Agent in 2014
Tom Cash
Luxe Group LLC
(804) 399-2906
Estimated Value: $654,748 - $741,000
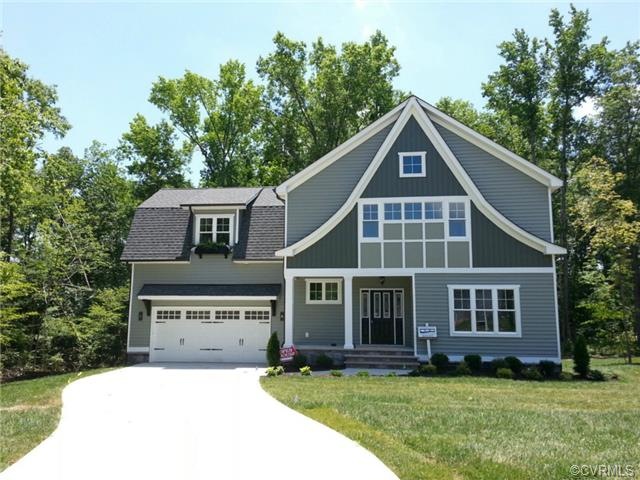
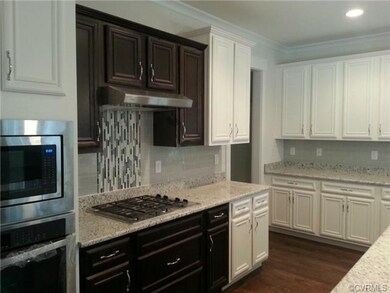
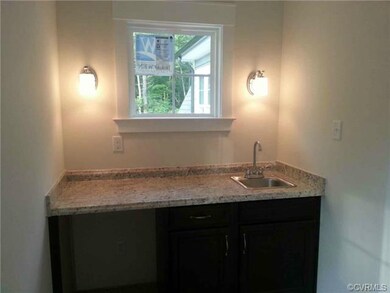
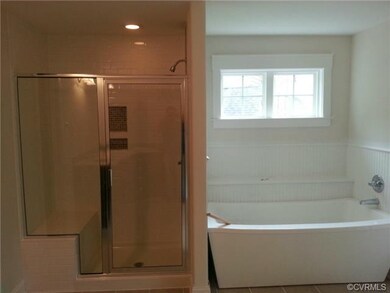
A great new plan by River City Custom Homes. This plan is very open and complimented with all the upgrades for todays busy lifestyles like: Hardwood Floors, Granite Countertops, Ceramic Tile Floors, Sunroom, Huge Master sweet with 2 closets, Covered Rear Porch, nestled on a cul-de-sac lot with green space in the rear for privacy. Come see all we have to offer in Rountrey.
| Date | Buyer | Sale Price | Title Company |
|---|---|---|---|
| River City Custom Homes Inc | $409,000 | -- |
| Date | Status | Borrower | Loan Amount |
|---|---|---|---|
| Open | River City Custom Homes Inc | $327,200 |
| Date | Event | Price | List to Sale | Price per Sq Ft |
|---|---|---|---|---|
| 09/25/2014 09/25/14 | Sold | $409,000 | -0.2% | $136 / Sq Ft |
| 08/26/2014 08/26/14 | Pending | -- | -- | -- |
| 07/16/2014 07/16/14 | For Sale | $409,950 | -- | $136 / Sq Ft |
| Year | Tax Paid | Tax Assessment Tax Assessment Total Assessment is a certain percentage of the fair market value that is determined by local assessors to be the total taxable value of land and additions on the property. | Land | Improvement |
|---|---|---|---|---|
| 2025 | $5,102 | $570,400 | $115,000 | $455,400 |
| 2024 | $5,102 | $570,400 | $115,000 | $455,400 |
| 2023 | $4,871 | $535,300 | $110,000 | $425,300 |
| 2022 | $4,407 | $479,000 | $103,000 | $376,000 |
| 2021 | $4,146 | $433,800 | $101,000 | $332,800 |
| 2020 | $3,996 | $420,600 | $101,000 | $319,600 |
| 2019 | $3,996 | $420,600 | $101,000 | $319,600 |
| 2018 | $3,962 | $417,100 | $100,000 | $317,100 |
| 2017 | $3,753 | $390,900 | $95,000 | $295,900 |
| 2016 | $3,765 | $392,200 | $95,000 | $297,200 |
| 2015 | $3,620 | $375,800 | $90,000 | $285,800 |
| 2014 | $1,056 | $110,000 | $85,000 | $25,000 |
Seller's Agent in 2014
Tom Cash
Luxe Group LLC
(804) 399-2906
Buyer's Agent in 2014
Mary Boese
Napier REALTORS ERA
(804) 334-5136
1 in this area
24 Total Sales
Source: Central Virginia Regional MLS
MLS Number: 1420331
APN: 718-69-08-84-000-000
Disclaimer: Certain information contained herein is derived from information provided by parties other than Homes.com. All information provided is deemed reliable, but is not guaranteed to be accurate and should be independently verified.
![]() All or a portion of th multiple Listing information is provided by the Central Virginia Regional Multiple Listing Service, LLC, from a copyrighted compilation of Listing s. All CVR MLS information provided is deemed reliable but is not guaranteed accurate. The compilation of Listings and each individual Listing are ©2025 Central Virginia Regional Multiple Listing Service, LLC. All rights reserved.
All or a portion of th multiple Listing information is provided by the Central Virginia Regional Multiple Listing Service, LLC, from a copyrighted compilation of Listing s. All CVR MLS information provided is deemed reliable but is not guaranteed accurate. The compilation of Listings and each individual Listing are ©2025 Central Virginia Regional Multiple Listing Service, LLC. All rights reserved.