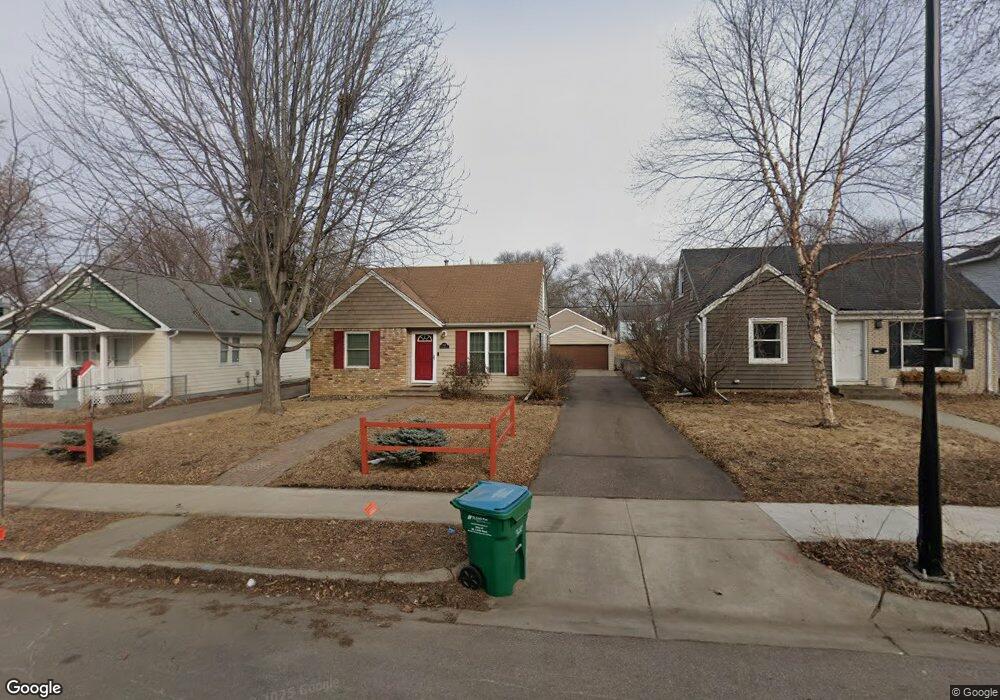
3325 Texas Ave S Saint Louis Park, MN 55426
Oak Hill NeighborhoodEstimated Value: $337,161 - $365,000
3
Beds
1
Bath
1,383
Sq Ft
$251/Sq Ft
Est. Value
About This Home
This home is located at 3325 Texas Ave S, Saint Louis Park, MN 55426 and is currently estimated at $347,290, approximately $251 per square foot. 3325 Texas Ave S is a home located in Hennepin County with nearby schools including Aquila Elementary School, St. Louis Park Middle School, and St. Louis Park High School.
Ownership History
Date
Name
Owned For
Owner Type
Purchase Details
Closed on
Feb 4, 2020
Sold by
Anderson Bryce and Anderson Heather
Bought by
Adesoro Sebastian and Adesoro Laura
Current Estimated Value
Home Financials for this Owner
Home Financials are based on the most recent Mortgage that was taken out on this home.
Original Mortgage
$256,405
Outstanding Balance
$227,544
Interest Rate
3.72%
Mortgage Type
New Conventional
Estimated Equity
$119,746
Purchase Details
Closed on
Apr 15, 2013
Sold by
Rasmusson Paul A
Bought by
Anderson Bryce
Home Financials for this Owner
Home Financials are based on the most recent Mortgage that was taken out on this home.
Original Mortgage
$156,000
Interest Rate
3.6%
Mortgage Type
New Conventional
Purchase Details
Closed on
Nov 21, 2008
Sold by
Nichols Chris
Bought by
Rasmusson Paul A and Sticha Kendra J
Purchase Details
Closed on
Apr 24, 2003
Sold by
Stasica Paul A
Bought by
Nichols Chris
Purchase Details
Closed on
Jan 1, 1998
Sold by
Haack Dennis D
Bought by
Stasica Paul A and Stasica Trine A
Create a Home Valuation Report for This Property
The Home Valuation Report is an in-depth analysis detailing your home's value as well as a comparison with similar homes in the area
Home Values in the Area
Average Home Value in this Area
Purchase History
| Date | Buyer | Sale Price | Title Company |
|---|---|---|---|
| Adesoro Sebastian | $269,900 | Edina Realty Title Inc | |
| Anderson Bryce | $189,264 | Global Closing & Title Svcs | |
| Rasmusson Paul A | $192,308 | -- | |
| Nichols Chris | $180,500 | -- | |
| Stasica Paul A | $99,000 | -- |
Source: Public Records
Mortgage History
| Date | Status | Borrower | Loan Amount |
|---|---|---|---|
| Open | Adesoro Sebastian | $256,405 | |
| Previous Owner | Anderson Bryce | $156,000 |
Source: Public Records
Tax History Compared to Growth
Tax History
| Year | Tax Paid | Tax Assessment Tax Assessment Total Assessment is a certain percentage of the fair market value that is determined by local assessors to be the total taxable value of land and additions on the property. | Land | Improvement |
|---|---|---|---|---|
| 2024 | $4,287 | $321,300 | $123,900 | $197,400 |
| 2023 | $3,928 | $303,500 | $123,900 | $179,600 |
| 2022 | $3,745 | $316,400 | $123,300 | $193,100 |
| 2021 | $3,358 | $289,600 | $107,300 | $182,300 |
| 2020 | $3,501 | $265,000 | $102,200 | $162,800 |
| 2019 | $3,221 | $265,000 | $97,400 | $167,600 |
| 2018 | $2,960 | $238,600 | $92,800 | $145,800 |
| 2017 | $2,541 | $193,800 | $73,400 | $120,400 |
| 2016 | $2,589 | $190,700 | $66,300 | $124,400 |
| 2015 | $2,359 | $171,800 | $62,000 | $109,800 |
| 2014 | -- | $153,900 | $58,800 | $95,100 |
Source: Public Records
Map
Nearby Homes
- 8200 W 33rd St Unit 208
- 8200 W 33rd St Unit 222
- 8200 W 33rd St Unit 305
- 3416 Sumter Ave S
- 3200 Virginia Ave S Unit 209
- 3101 Sumter Ave S
- 3505 Wyoming Ave S
- 3304 Yukon Ave S
- 3601 Texas Ave S
- 3153 Nevada Ave S
- 3613 Rhode Island Ave S
- 3149 Nevada Ave S
- 3300 Louisiana Ave S Unit 523
- 3320 Louisiana Ave S Unit 311
- 3320 Louisiana Ave S Unit 410
- 3320 Louisiana Ave S Unit 310
- 3300 Louisiana Ave S Unit 517
- 3320 Louisiana Ave S Unit 106
- 3300 Louisiana Ave S Unit 422
- 3124 Maryland Ave S
- 3317 Texas Ave S
- 3333 Texas Ave S
- 3317 Texas Ave S
- 3309 Texas Ave S
- 3341 Texas Ave S
- 3325 3325 Texas-Avenue-s
- 3309 Texas Ave S
- 3324 Sumter Ave S
- 3332 Sumter Ave S
- 3316 Sumter Ave S
- 3301 Texas Ave S
- 3349 Texas Ave S
- 3300 3300 Texas-Avenue-s
- 3340 Sumter Ave S
- 3308 Sumter Ave S
- 3301 3301 Texas-Avenue-s
- 3324 Texas Ave S
- 3357 Texas Ave S
- 3316 Texas Ave S
- 3348 Sumter Ave S