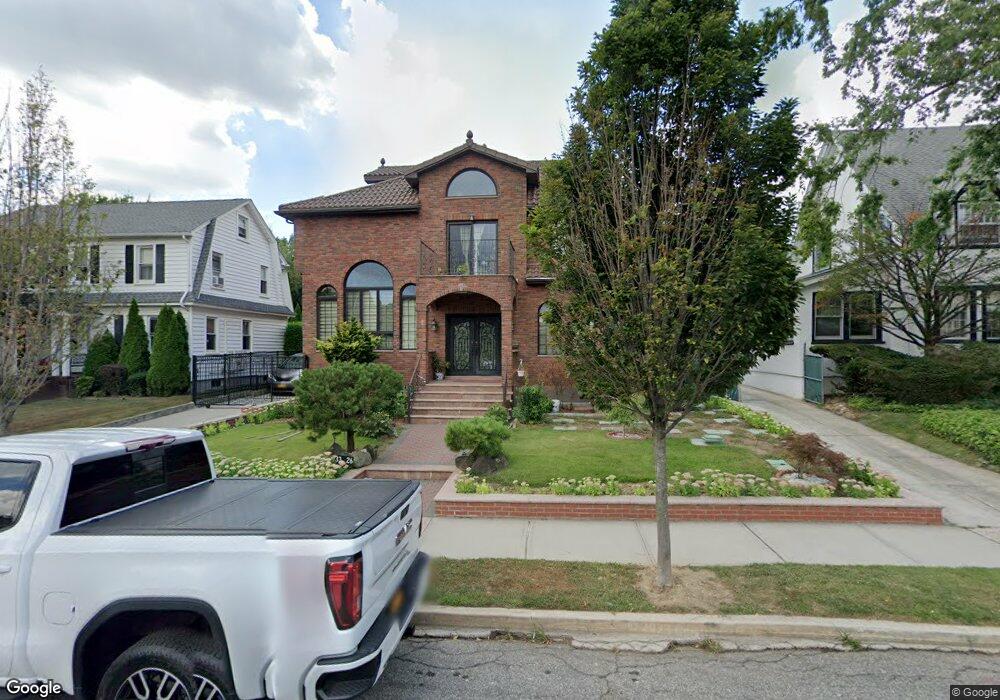
3326 158th St Flushing, NY 11358
Murray Hill-Broadway NeighborhoodEstimated Value: $1,754,000 - $2,081,000
Studio
--
Bath
2,968
Sq Ft
$646/Sq Ft
Est. Value
About This Home
This home is located at 3326 158th St, Flushing, NY 11358 and is currently estimated at $1,917,351, approximately $646 per square foot. 3326 158th St is a home located in Queens County with nearby schools including P.S. 32 - State Street, I.S. 25 Adrien Block, and Francis Lewis High School.
Ownership History
Date
Name
Owned For
Owner Type
Purchase Details
Closed on
Jul 23, 2019
Sold by
Yoo Jin Young and Yoo Maria H
Bought by
Duong Alan S Q and Duong Sharon B
Current Estimated Value
Purchase Details
Closed on
Sep 11, 2014
Sold by
Munoz Jose and Munoz Lucile Noel
Bought by
Yoo Jin Young and Yoo Maria H
Home Financials for this Owner
Home Financials are based on the most recent Mortgage that was taken out on this home.
Original Mortgage
$600,000
Interest Rate
4.12%
Mortgage Type
New Conventional
Purchase Details
Closed on
Aug 15, 2008
Sold by
Carabba William A
Bought by
Munoz Jose and Munoz Lucille
Home Financials for this Owner
Home Financials are based on the most recent Mortgage that was taken out on this home.
Original Mortgage
$42,000
Interest Rate
6.29%
Create a Home Valuation Report for This Property
The Home Valuation Report is an in-depth analysis detailing your home's value as well as a comparison with similar homes in the area
Home Values in the Area
Average Home Value in this Area
Purchase History
| Date | Buyer | Sale Price | Title Company |
|---|---|---|---|
| Duong Alan S Q | $1,600,000 | -- | |
| Duong Alan S Q | $1,600,000 | -- | |
| Yoo Jin Young | $870,000 | -- | |
| Yoo Jin Young | $870,000 | -- | |
| Munoz Jose | $890,000 | -- | |
| Munoz Jose | $890,000 | -- |
Source: Public Records
Mortgage History
| Date | Status | Borrower | Loan Amount |
|---|---|---|---|
| Previous Owner | Yoo Jin Young | $600,000 | |
| Previous Owner | Munoz Jose | $42,000 | |
| Previous Owner | Munoz Jose | $708,000 |
Source: Public Records
Tax History
| Year | Tax Paid | Tax Assessment Tax Assessment Total Assessment is a certain percentage of the fair market value that is determined by local assessors to be the total taxable value of land and additions on the property. | Land | Improvement |
|---|---|---|---|---|
| 2025 | $11,188 | $58,325 | $15,874 | $42,451 |
| 2024 | $11,188 | $55,703 | $15,293 | $40,410 |
| 2023 | $10,555 | $52,550 | $12,662 | $39,888 |
| 2022 | $9,399 | $102,420 | $26,340 | $76,080 |
| 2021 | $10,473 | $91,320 | $26,340 | $64,980 |
| 2020 | $10,288 | $80,400 | $26,340 | $54,060 |
| 2019 | $9,710 | $88,560 | $26,340 | $62,220 |
| 2018 | $8,927 | $43,792 | $14,157 | $29,635 |
| 2017 | $8,454 | $41,472 | $17,797 | $23,675 |
| 2016 | $7,981 | $41,472 | $17,797 | $23,675 |
| 2015 | $4,499 | $40,503 | $19,017 | $21,486 |
| 2014 | $4,499 | $38,683 | $21,799 | $16,884 |
Source: Public Records
Map
Nearby Homes
Your Personal Tour Guide
Ask me questions while you tour the home.