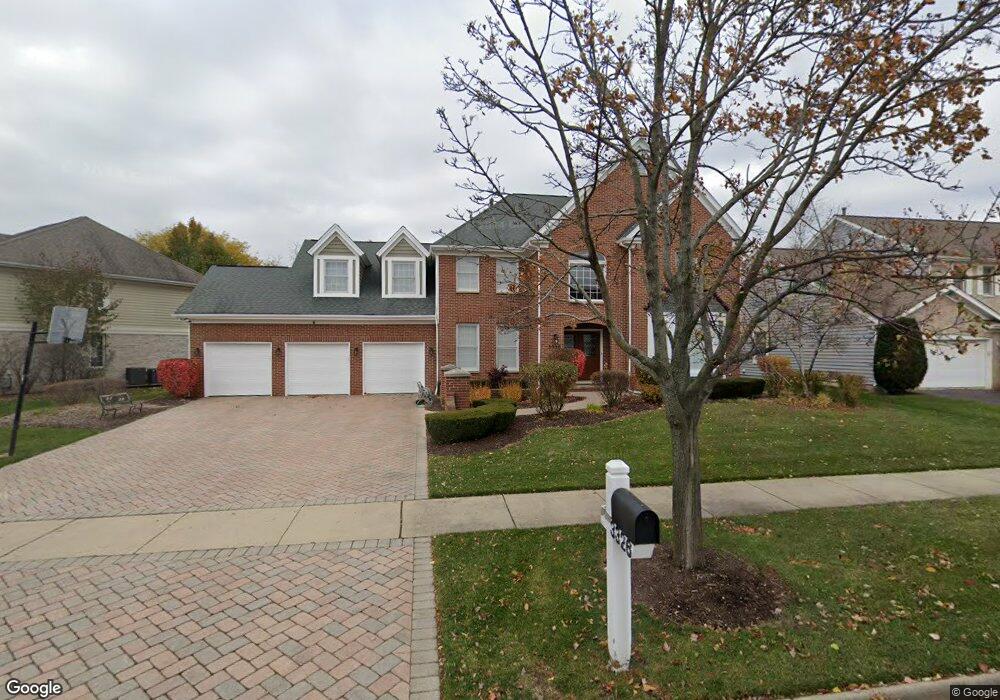
3326 Winchester Ln Glenview, IL 60026
The Willows NeighborhoodEstimated Value: $1,059,000 - $1,675,000
4
Beds
4
Baths
3,749
Sq Ft
$344/Sq Ft
Est. Value
About This Home
This home is located at 3326 Winchester Ln, Glenview, IL 60026 and is currently estimated at $1,290,103, approximately $344 per square foot. 3326 Winchester Ln is a home located in Cook County with nearby schools including Westbrook Elementary School, Glen Grove Elementary School, and Attea Middle School.
Ownership History
Date
Name
Owned For
Owner Type
Purchase Details
Closed on
Sep 27, 2013
Sold by
Hvostik George R and Hvostik Stephanie
Bought by
Khan Marghoob Ahmad and Hussain Ayesha
Current Estimated Value
Home Financials for this Owner
Home Financials are based on the most recent Mortgage that was taken out on this home.
Original Mortgage
$675,000
Outstanding Balance
$493,379
Interest Rate
4.12%
Mortgage Type
Adjustable Rate Mortgage/ARM
Estimated Equity
$796,724
Purchase Details
Closed on
Nov 7, 1997
Sold by
Zimmerman Paul T and Zimmerman Cynthia S
Bought by
Hvostik George R
Home Financials for this Owner
Home Financials are based on the most recent Mortgage that was taken out on this home.
Original Mortgage
$400,000
Interest Rate
7.46%
Purchase Details
Closed on
May 16, 1994
Sold by
Glenlake Venture
Bought by
Zimmermann Paul T and Zimmermann Cynthia S
Home Financials for this Owner
Home Financials are based on the most recent Mortgage that was taken out on this home.
Original Mortgage
$459,120
Interest Rate
8.08%
Create a Home Valuation Report for This Property
The Home Valuation Report is an in-depth analysis detailing your home's value as well as a comparison with similar homes in the area
Home Values in the Area
Average Home Value in this Area
Purchase History
| Date | Buyer | Sale Price | Title Company |
|---|---|---|---|
| Khan Marghoob Ahmad | $750,000 | Attorneys Title Guaranty Fun | |
| Hvostik George R | $562,500 | -- | |
| Zimmermann Paul T | $574,000 | -- |
Source: Public Records
Mortgage History
| Date | Status | Borrower | Loan Amount |
|---|---|---|---|
| Open | Khan Marghoob Ahmad | $675,000 | |
| Previous Owner | Hvostik George R | $400,000 | |
| Previous Owner | Zimmermann Paul T | $459,120 |
Source: Public Records
Tax History
| Year | Tax Paid | Tax Assessment Tax Assessment Total Assessment is a certain percentage of the fair market value that is determined by local assessors to be the total taxable value of land and additions on the property. | Land | Improvement |
|---|---|---|---|---|
| 2025 | $17,264 | $102,000 | $24,065 | $77,935 |
| 2024 | $17,264 | $78,000 | $20,147 | $57,853 |
| 2023 | $16,777 | $78,000 | $20,147 | $57,853 |
| 2022 | $16,777 | $78,000 | $20,147 | $57,853 |
| 2021 | $16,777 | $67,405 | $13,711 | $53,694 |
| 2020 | $16,578 | $67,405 | $13,711 | $53,694 |
| 2019 | $15,622 | $74,895 | $13,711 | $61,184 |
| 2018 | $16,885 | $73,418 | $12,032 | $61,386 |
| 2017 | $16,436 | $73,418 | $12,032 | $61,386 |
| 2016 | $15,530 | $73,418 | $12,032 | $61,386 |
| 2015 | $14,881 | $62,488 | $9,793 | $52,695 |
| 2014 | $14,608 | $62,488 | $9,793 | $52,695 |
| 2013 | $13,567 | $62,488 | $9,793 | $52,695 |
Source: Public Records
Map
Nearby Homes
- 2137 Dauntless Dr
- 1605 Elmdale Ave
- 1615 Greenwood Rd
- 3820 Kiess Dr
- 3800 Kiess Dr
- 3849 Grace Ln
- 2431 Cobblewood Dr Unit 9
- 1867 Admiral Ct Unit 91
- 102 Yale Ct Unit 34LH10
- 2571 Essex Dr
- 3246 Landwehr Rd Unit 3
- 1594 Portage Run
- 3190 Landwehr Rd
- 3212 Lindenwood Ln
- 3256 Westview Dr
- 3255 Westview Dr
- 2230 Goldenrod Ln
- 3336 Overland Pass
- 3407 Springdale Ave
- 3843 Springdale Ave
- 3324 Winchester Ln
- 3330 Winchester Ln
- 2107 Inverness Ln
- 2111 Inverness Ln
- 3320 Winchester Ln
- 3408 Winchester Ln
- 3319 Winchester Ln
- 3319 Winchester Ln
- 3319 Winchester Ln
- 3323 Winchester Ln
- 3327 Winchester Ln
- 2115 Inverness Ln
- 3331 Winchester Ln
- 3315 Winchester Ln
- 2114 Winchester Ln
- 3403 Winchester Ln
- 3407 Winchester Ln
- 3311 Winchester Ln
- 2119 Inverness Ln
- 3150 Landwehr Rd
Your Personal Tour Guide
Ask me questions while you tour the home.