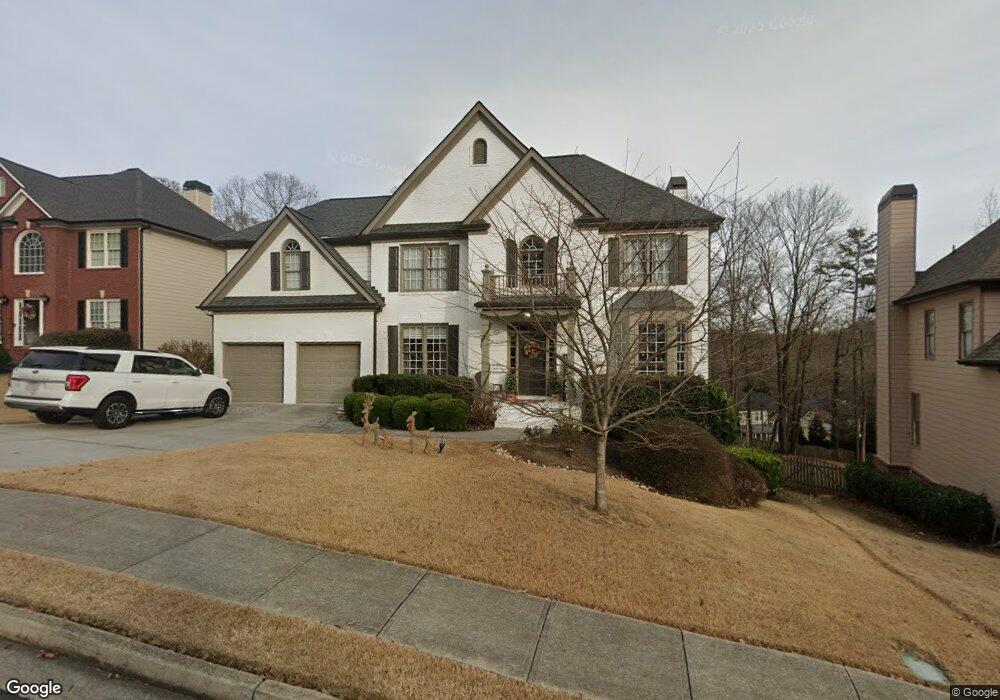
3327 Highland Forge Trail Dacula, GA 30019
Estimated Value: $559,000 - $588,000
5
Beds
4
Baths
3,556
Sq Ft
$162/Sq Ft
Est. Value
About This Home
This home is located at 3327 Highland Forge Trail, Dacula, GA 30019 and is currently estimated at $576,156, approximately $162 per square foot. 3327 Highland Forge Trail is a home located in Gwinnett County with nearby schools including Puckett's Mill Elementary School, Frank N. Osborne Middle School, and Mill Creek High School.
Ownership History
Date
Name
Owned For
Owner Type
Purchase Details
Closed on
Jan 7, 2010
Sold by
Bell Thomas and Bell Aimee
Bought by
Bradley Joe C and Bradley Jessica A
Current Estimated Value
Home Financials for this Owner
Home Financials are based on the most recent Mortgage that was taken out on this home.
Original Mortgage
$214,051
Outstanding Balance
$138,835
Interest Rate
4.87%
Mortgage Type
FHA
Estimated Equity
$437,321
Purchase Details
Closed on
Mar 15, 2001
Sold by
Touchstone Homes Inc
Bought by
Bell Thomas and Bell Aimes
Home Financials for this Owner
Home Financials are based on the most recent Mortgage that was taken out on this home.
Original Mortgage
$26,166
Interest Rate
7.11%
Mortgage Type
Unknown
Create a Home Valuation Report for This Property
The Home Valuation Report is an in-depth analysis detailing your home's value as well as a comparison with similar homes in the area
Home Values in the Area
Average Home Value in this Area
Purchase History
| Date | Buyer | Sale Price | Title Company |
|---|---|---|---|
| Bradley Joe C | $218,000 | -- | |
| Bell Thomas | $258,900 | -- |
Source: Public Records
Mortgage History
| Date | Status | Borrower | Loan Amount |
|---|---|---|---|
| Open | Bradley Joe C | $214,051 | |
| Previous Owner | Bell Thomas | $26,166 | |
| Previous Owner | Bell Thomas | $207,120 | |
| Previous Owner | Bell Thomas | $26,166 |
Source: Public Records
Tax History Compared to Growth
Tax History
| Year | Tax Paid | Tax Assessment Tax Assessment Total Assessment is a certain percentage of the fair market value that is determined by local assessors to be the total taxable value of land and additions on the property. | Land | Improvement |
|---|---|---|---|---|
| 2025 | $6,225 | $233,400 | $59,840 | $173,560 |
| 2024 | $6,247 | $224,960 | $45,600 | $179,360 |
| 2023 | $6,247 | $207,960 | $45,600 | $162,360 |
| 2022 | $5,285 | $179,920 | $40,400 | $139,520 |
| 2021 | $4,499 | $138,320 | $27,200 | $111,120 |
| 2020 | $4,531 | $138,320 | $27,200 | $111,120 |
| 2019 | $4,403 | $138,320 | $27,200 | $111,120 |
| 2018 | $4,212 | $129,120 | $27,200 | $101,920 |
| 2016 | $4,116 | $123,640 | $24,000 | $99,640 |
| 2015 | $3,802 | $107,480 | $22,800 | $84,680 |
| 2014 | $3,821 | $107,480 | $22,800 | $84,680 |
Source: Public Records
Map
Nearby Homes
- 3304 Brooksong Way Unit 2
- 1470 Highland Forge Ct
- 1495 Mill Place Dr
- 2636 Grove Valley Ln
- 1372 Auburn Rd
- 1758 Auburn Ridge Way
- 170 Ewing Way
- 1 Ewing Way
- 255 Old Town Rd
- 3763 Terrace Hedge Ct
- 1385 Auburn Glen Rd
- 1385 Auburn Rd
- 1355 Auburn Glen Rd
- 3194 Eastham Run Dr
- 1356 Belfaire Trace
- 3177 Hog Mountain Rd
- 1345 Auburn Glen Rd
- 1335 Auburn Glen Rd
- 3337 Highland Forge Trail
- 3317 Highland Forge Trail
- 1434 Millmoore Terrace
- 3347 Highland Forge Trail
- 1444 Millmoore Terrace
- 3307 Highland Forge Trail
- 3318 Highland Forge Trail
- 1406 Highland Heights Trail
- 1424 Millmoore Terrace
- 0 Highland Forge Trail Unit 8047607
- 0 Highland Forge Trail Unit 8211320
- 0 Highland Forge Trail Unit 8199080
- 0 Highland Forge Trail Unit 7286276
- 0 Highland Forge Trail Unit 8891430
- 0 Highland Forge Trail Unit 7112366
- 0 Highland Forge Trail Unit 7199375
- 0 Highland Forge Trail Unit 7244346
- 0 Highland Forge Trail Unit 7296214
- 1454 Millmoore Terrace
- 3357 Highland Forge Trail