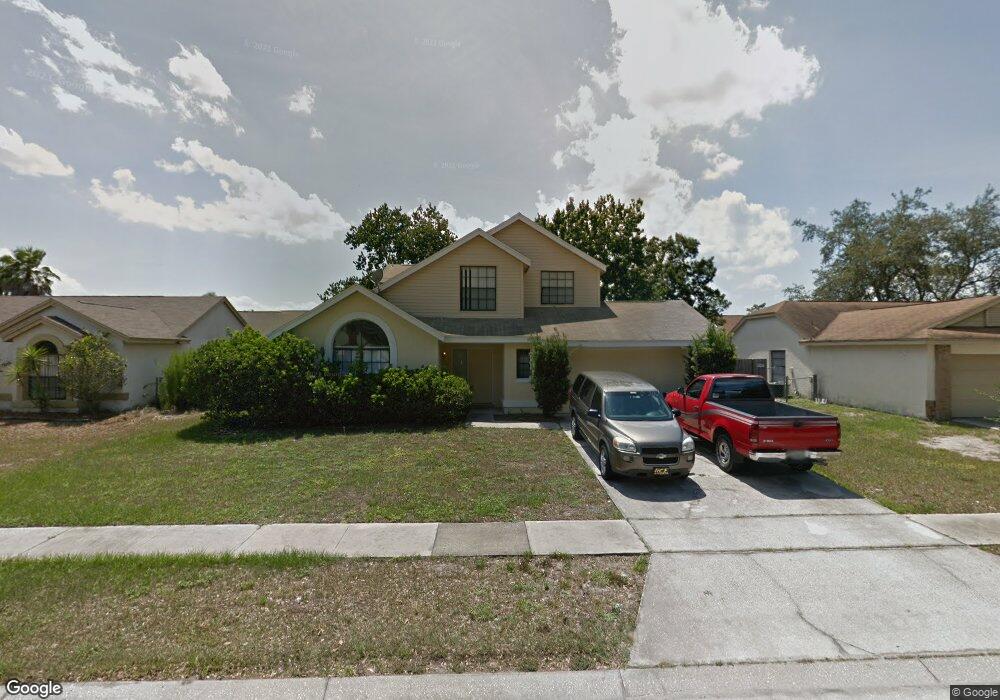
3328 Spotted Fawn Dr Orlando, FL 32817
Estimated Value: $367,363 - $407,000
3
Beds
3
Baths
1,630
Sq Ft
$236/Sq Ft
Est. Value
About This Home
This home is located at 3328 Spotted Fawn Dr, Orlando, FL 32817 and is currently estimated at $384,591, approximately $235 per square foot. 3328 Spotted Fawn Dr is a home located in Orange County with nearby schools including Riverdale Elementary School, Union Park Middle School, and University High School.
Ownership History
Date
Name
Owned For
Owner Type
Purchase Details
Closed on
Jul 25, 2017
Sold by
Reed John R
Bought by
Hernandez Eric
Current Estimated Value
Home Financials for this Owner
Home Financials are based on the most recent Mortgage that was taken out on this home.
Original Mortgage
$211,850
Outstanding Balance
$176,108
Interest Rate
3.91%
Mortgage Type
New Conventional
Estimated Equity
$208,483
Purchase Details
Closed on
Feb 5, 2007
Sold by
Allen Paul Robert and Heller Allen Cheryl Joy
Bought by
Reed John R
Home Financials for this Owner
Home Financials are based on the most recent Mortgage that was taken out on this home.
Original Mortgage
$185,600
Interest Rate
6.14%
Mortgage Type
Purchase Money Mortgage
Purchase Details
Closed on
Mar 11, 1999
Sold by
Hellen David A
Bought by
Allen Paul R and Heller-Allen Cheryl J
Create a Home Valuation Report for This Property
The Home Valuation Report is an in-depth analysis detailing your home's value as well as a comparison with similar homes in the area
Home Values in the Area
Average Home Value in this Area
Purchase History
| Date | Buyer | Sale Price | Title Company |
|---|---|---|---|
| Hernandez Eric | $223,000 | Fidelity National Title Of F | |
| Reed John R | $232,000 | Attorney | |
| Allen Paul R | $63,000 | -- |
Source: Public Records
Mortgage History
| Date | Status | Borrower | Loan Amount |
|---|---|---|---|
| Open | Hernandez Eric | $211,850 | |
| Previous Owner | Reed John R | $185,600 | |
| Previous Owner | Allen Paul R | $128,000 | |
| Previous Owner | Allen Paul R | $64,750 | |
| Previous Owner | Allen Paul R | $38,241 |
Source: Public Records
Tax History Compared to Growth
Tax History
| Year | Tax Paid | Tax Assessment Tax Assessment Total Assessment is a certain percentage of the fair market value that is determined by local assessors to be the total taxable value of land and additions on the property. | Land | Improvement |
|---|---|---|---|---|
| 2025 | $2,960 | $200,877 | -- | -- |
| 2024 | $2,754 | $200,877 | -- | -- |
| 2023 | $2,754 | $189,530 | $0 | $0 |
| 2022 | $2,636 | $184,010 | $0 | $0 |
| 2021 | $2,588 | $178,650 | $0 | $0 |
| 2020 | $2,464 | $176,183 | $0 | $0 |
| 2019 | $2,527 | $172,222 | $0 | $0 |
| 2018 | $2,494 | $169,011 | $42,500 | $126,511 |
| 2017 | $2,759 | $149,831 | $37,500 | $112,331 |
| 2016 | $2,624 | $144,068 | $35,000 | $109,068 |
| 2015 | $2,522 | $137,402 | $35,000 | $102,402 |
| 2014 | $2,364 | $122,421 | $40,000 | $82,421 |
Source: Public Records
Map
Nearby Homes
- 3136 Riverdale Rd
- 3003 Riverdale Rd
- 3043 Riverdale Rd
- 2341 Rouse Rd
- 2917 Cleburne Rd
- 3309 Paisley Cir
- 10418 Sun Villa Blvd
- 2908 Cleburne Rd
- 2904 Cleburne Rd
- 2850 Cleburne Rd
- 10815 Dearden Cir
- 2900 Cleburne Rd
- 3718 Rouse Rd
- 3230 Buck Hill Place
- 10544 Wyndcliff Dr
- 10336 Buck Rd
- 10805 Oak Glen Cir
- 4026 Montara Ct
- 4231 Sandhurst Dr
- 10915 Piping Rock Cir
- 3334 Spotted Fawn Dr
- 3322 Spotted Fawn Dr
- 3263 Hillmont Cir
- 3269 Hillmont Cir
- 3257 Hillmont Cir
- 3340 Spotted Fawn Dr
- 3316 Spotted Fawn Dr
- 3327 Spotted Fawn Dr
- 3321 Spotted Fawn Dr
- 3333 Spotted Fawn Dr
- 3275 Hillmont Cir
- 3251 Hillmont Cir
- 3339 Spotted Fawn Dr
- 3315 Spotted Fawn Dr
- 3346 Spotted Fawn Dr
- 3310 Spotted Fawn Dr
- 3245 Hillmont Cir
- 3281 Hillmont Cir
- 3317 Hillmont Cir
- 3264 Hillmont Cir