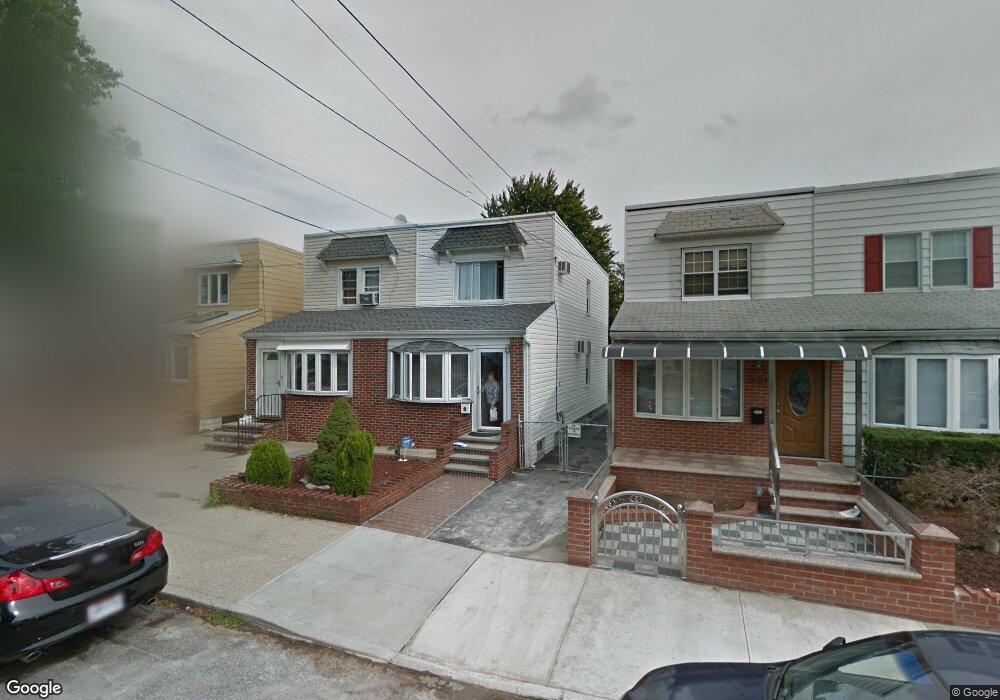
3329 Jordan St Flushing, NY 11358
Auburndale NeighborhoodEstimated Value: $793,811 - $847,000
--
Bed
--
Bath
1,080
Sq Ft
$767/Sq Ft
Est. Value
About This Home
This home is located at 3329 Jordan St, Flushing, NY 11358 and is currently estimated at $828,703, approximately $767 per square foot. 3329 Jordan St is a home located in Queens County with nearby schools including P.S. 159 Queens, I.S. 25 Adrien Block, and Bayside High School.
Ownership History
Date
Name
Owned For
Owner Type
Purchase Details
Closed on
Jul 8, 2016
Sold by
Gonzalez Audrey and Malespin Audrey
Bought by
Dong Lan Fang
Current Estimated Value
Home Financials for this Owner
Home Financials are based on the most recent Mortgage that was taken out on this home.
Original Mortgage
$240,000
Outstanding Balance
$189,485
Interest Rate
3.41%
Mortgage Type
New Conventional
Estimated Equity
$639,218
Purchase Details
Closed on
Mar 29, 2000
Sold by
Soricillo Stacey
Bought by
Kazimiroff Theodore and Kazimiroff Linda
Home Financials for this Owner
Home Financials are based on the most recent Mortgage that was taken out on this home.
Original Mortgage
$176,300
Interest Rate
8.21%
Create a Home Valuation Report for This Property
The Home Valuation Report is an in-depth analysis detailing your home's value as well as a comparison with similar homes in the area
Home Values in the Area
Average Home Value in this Area
Purchase History
| Date | Buyer | Sale Price | Title Company |
|---|---|---|---|
| Dong Lan Fang | $593,000 | -- | |
| Dong Lan Fang | $593,000 | -- | |
| Dong Lan Fang | $593,000 | -- | |
| Kazimiroff Theodore | $196,000 | Commonwealth Land Title Ins | |
| Kazimiroff Theodore | $196,000 | Commonwealth Land Title Ins |
Source: Public Records
Mortgage History
| Date | Status | Borrower | Loan Amount |
|---|---|---|---|
| Open | Dong Lan Fang | $240,000 | |
| Closed | Dong Lan Fang | $240,000 | |
| Previous Owner | Kazimiroff Theodore | $176,300 |
Source: Public Records
Tax History Compared to Growth
Tax History
| Year | Tax Paid | Tax Assessment Tax Assessment Total Assessment is a certain percentage of the fair market value that is determined by local assessors to be the total taxable value of land and additions on the property. | Land | Improvement |
|---|---|---|---|---|
| 2025 | $4,922 | $25,259 | $5,753 | $19,506 |
| 2024 | $4,922 | $24,504 | $6,207 | $18,297 |
| 2023 | $4,663 | $23,216 | $5,449 | $17,767 |
| 2022 | $4,377 | $48,540 | $11,520 | $37,020 |
| 2021 | $4,434 | $44,880 | $11,520 | $33,360 |
| 2020 | $4,455 | $43,200 | $11,520 | $31,680 |
| 2019 | $4,272 | $41,940 | $11,520 | $30,420 |
| 2018 | $3,944 | $19,347 | $5,463 | $13,884 |
| 2017 | $3,425 | $18,270 | $6,187 | $12,083 |
| 2016 | $3,200 | $18,270 | $6,187 | $12,083 |
| 2015 | $1,859 | $17,541 | $7,369 | $10,172 |
| 2014 | $1,859 | $17,017 | $7,795 | $9,222 |
Source: Public Records
Map
Nearby Homes
- 19934 34th Ave
- 200-14 34th Ave
- 3321 201st St
- 20015 33rd Ave
- 190-16 33rd Ave
- 34-41 201st St
- 20206 33rd Ave
- 32-28 202nd St
- 3314 204th St
- 36-20 194th St Unit 3r
- 203-07 35th Ave Unit B
- 3617 194th St
- 35-16 203rd St
- 3335 204th St
- 3337 204th St
- 35-05 204th St Unit 245
- 35-27 203rd St
- 204-8 35th Ave Unit 247
- 204-12 35th Ave Unit 254
- 3211 204th St