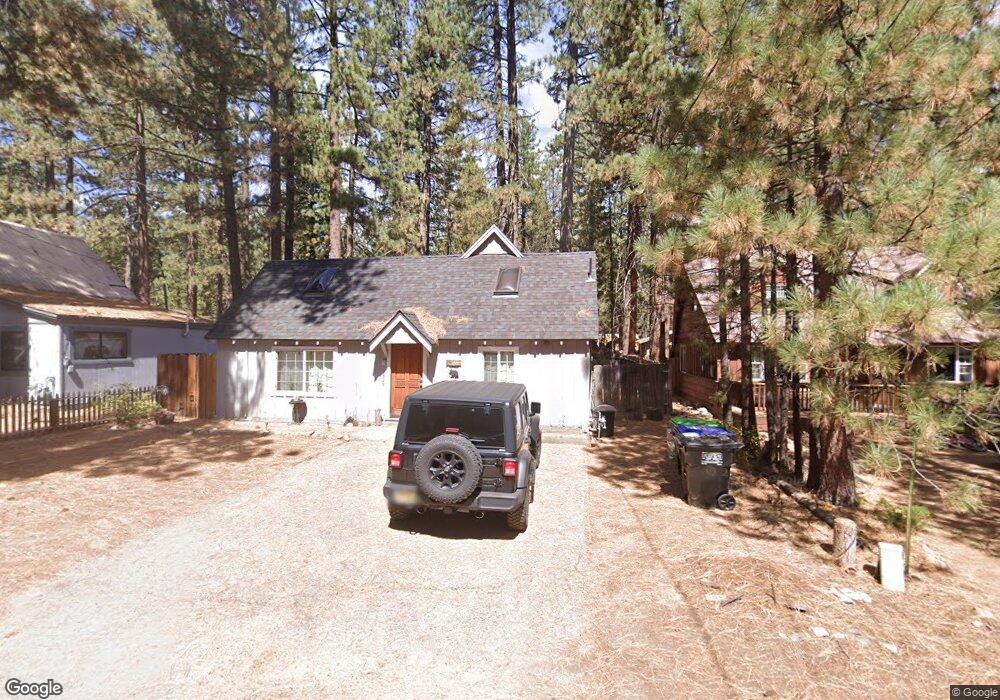
3329 Pickett Ave South Lake Tahoe, CA 96150
Estimated Value: $475,000 - $625,000
2
Beds
1
Bath
1,264
Sq Ft
$420/Sq Ft
Est. Value
About This Home
This home is located at 3329 Pickett Ave, South Lake Tahoe, CA 96150 and is currently estimated at $531,315, approximately $420 per square foot. 3329 Pickett Ave is a home located in El Dorado County with nearby schools including Bijou Community, South Tahoe Middle School, and South Tahoe High School.
Ownership History
Date
Name
Owned For
Owner Type
Purchase Details
Closed on
Oct 24, 2022
Sold by
Jonathan Peck 2021 Revocable Living Trus
Bought by
Peck Alex
Current Estimated Value
Purchase Details
Closed on
Oct 6, 2021
Sold by
Peck Jonathan
Bought by
Peck Jonathan and Peck Jonathan 2021
Purchase Details
Closed on
Dec 26, 2017
Sold by
Peck Stacy
Bought by
Peck Jonathan
Purchase Details
Closed on
Dec 6, 2001
Sold by
Williams Greg L and Williams Sharon L
Bought by
Peck Jonathan and Peck Stacy
Home Financials for this Owner
Home Financials are based on the most recent Mortgage that was taken out on this home.
Original Mortgage
$188,000
Interest Rate
6.39%
Purchase Details
Closed on
Oct 2, 1996
Sold by
Mitchell Marilyn D
Bought by
Williams Greg L and Williams Sharon L
Home Financials for this Owner
Home Financials are based on the most recent Mortgage that was taken out on this home.
Original Mortgage
$97,648
Interest Rate
8.1%
Mortgage Type
FHA
Create a Home Valuation Report for This Property
The Home Valuation Report is an in-depth analysis detailing your home's value as well as a comparison with similar homes in the area
Home Values in the Area
Average Home Value in this Area
Purchase History
| Date | Buyer | Sale Price | Title Company |
|---|---|---|---|
| Peck Alex | -- | -- | |
| Peck Jonathan | -- | None Available | |
| Peck Jonathan | -- | None Available | |
| Peck Jonathan | $235,000 | Old Republic Title Company | |
| Williams Greg L | $98,000 | Old Republic Title Company |
Source: Public Records
Mortgage History
| Date | Status | Borrower | Loan Amount |
|---|---|---|---|
| Previous Owner | Peck Jonathan | $188,000 | |
| Previous Owner | Williams Greg L | $97,648 |
Source: Public Records
Tax History Compared to Growth
Tax History
| Year | Tax Paid | Tax Assessment Tax Assessment Total Assessment is a certain percentage of the fair market value that is determined by local assessors to be the total taxable value of land and additions on the property. | Land | Improvement |
|---|---|---|---|---|
| 2025 | $4,416 | $416,160 | $130,050 | $286,110 |
| 2024 | $4,416 | $408,000 | $127,500 | $280,500 |
| 2023 | $4,340 | $400,000 | $125,000 | $275,000 |
| 2022 | $3,601 | $327,117 | $62,630 | $264,487 |
| 2021 | $3,546 | $320,703 | $61,402 | $259,301 |
| 2020 | $3,494 | $317,416 | $60,773 | $256,643 |
| 2019 | $3,478 | $311,193 | $59,582 | $251,611 |
| 2018 | $3,401 | $305,092 | $58,414 | $246,678 |
| 2017 | $2,977 | $265,000 | $56,147 | $208,853 |
| 2016 | $3,280 | $293,247 | $56,147 | $237,100 |
| 2015 | $2,781 | $288,844 | $55,304 | $233,540 |
| 2014 | $2,781 | $252,000 | $48,000 | $204,000 |
Source: Public Records
Map
Nearby Homes
- 3339 Cape Horn Rd
- 3334 Treehaven Dr
- 3338 Treehaven Dr
- 1149 Oak Ave
- 1094 Johnson Blvd
- 3275 Marlette Cir
- 1048 Trout Creek Ave
- 3229 Marlette Cir
- 3371 Lake Tahoe Blvd Unit 6
- 1022 Fairway Ave
- 960 San Francisco Ave
- 3520 Cloverdale Ave
- 3508 Fawn Way
- 1115 Glenwood Way
- 1201 Glenwood Way
- 920 Balbijou Rd Unit 229
- 1151 Herbert Ave Unit B
- 1304 Susie Lake Rd
- 3510 Rancho Cir
- 3140 Sacramento Ave
- 3333 Pickett Ave
- 3325 Pickett Ave
- 3337 Pickett Ave
- 3321 Pickett Ave
- 3328 Ash Ave
- 3332 Ash Ave
- 3324 Ash Ave
- 3330 Pickett Ave
- 3334 Ash Ave
- 3320 Ash Ave
- 3324 Pickett Ave
- 3336 Pickett Ave
- 3320 Pickett Ave
- 1105 Juniper Ave
- 1107 Juniper Ave
- 3340 Ash Ave
- 1101 Juniper Ave
- 3345 Pickett Ave
- 3340 Pickett Ave
- 1097 Juniper Ave