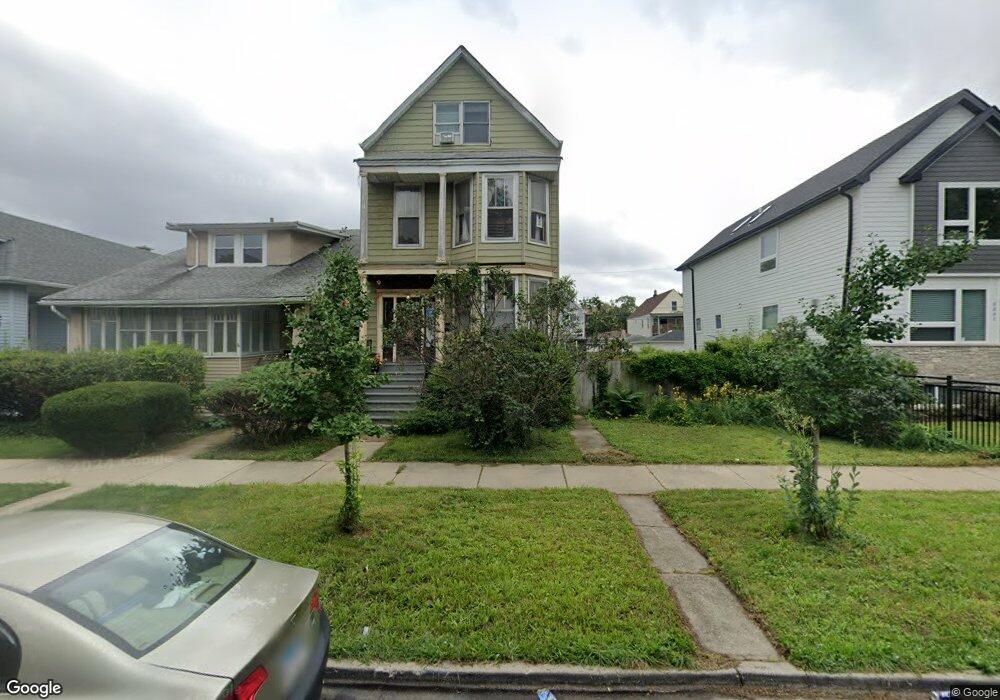
3329 W Hutchinson St Chicago, IL 60618
Irving Park NeighborhoodEstimated Value: $735,000
--
Bed
--
Bath
--
Sq Ft
0.71
Acres
About This Home
This home is located at 3329 W Hutchinson St, Chicago, IL 60618 and is currently estimated at $735,000. 3329 W Hutchinson St is a home located in Cook County with nearby schools including Henry Elementary School, Roosevelt High School, and CICS Irving Park.
Ownership History
Date
Name
Owned For
Owner Type
Purchase Details
Closed on
Sep 26, 2002
Sold by
Tully Larry R
Bought by
Robinson Mark and White Marie C
Current Estimated Value
Home Financials for this Owner
Home Financials are based on the most recent Mortgage that was taken out on this home.
Original Mortgage
$308,000
Outstanding Balance
$130,353
Interest Rate
6.29%
Mortgage Type
Purchase Money Mortgage
Estimated Equity
$604,647
Purchase Details
Closed on
Sep 18, 1998
Sold by
Zarantenello Ronald and Zarantenello Mario
Bought by
Tully Larry R
Home Financials for this Owner
Home Financials are based on the most recent Mortgage that was taken out on this home.
Original Mortgage
$174,000
Interest Rate
7.12%
Mortgage Type
Purchase Money Mortgage
Purchase Details
Closed on
Apr 29, 1996
Sold by
Robaczewski Donald and Rapp Jacob
Bought by
Zarantenello Mario and Zarantenello Ronald
Home Financials for this Owner
Home Financials are based on the most recent Mortgage that was taken out on this home.
Original Mortgage
$147,250
Interest Rate
7.86%
Mortgage Type
Purchase Money Mortgage
Create a Home Valuation Report for This Property
The Home Valuation Report is an in-depth analysis detailing your home's value as well as a comparison with similar homes in the area
Home Values in the Area
Average Home Value in this Area
Purchase History
| Date | Buyer | Sale Price | Title Company |
|---|---|---|---|
| Robinson Mark | $385,000 | -- | |
| Tully Larry R | $217,500 | -- | |
| Zarantenello Mario | $155,000 | -- |
Source: Public Records
Mortgage History
| Date | Status | Borrower | Loan Amount |
|---|---|---|---|
| Open | Robinson Mark | $308,000 | |
| Previous Owner | Tully Larry R | $174,000 | |
| Previous Owner | Zarantenello Mario | $147,250 | |
| Closed | Robinson Mark | $57,750 |
Source: Public Records
Tax History Compared to Growth
Tax History
| Year | Tax Paid | Tax Assessment Tax Assessment Total Assessment is a certain percentage of the fair market value that is determined by local assessors to be the total taxable value of land and additions on the property. | Land | Improvement |
|---|---|---|---|---|
| 2024 | $3,299 | $19,310 | $19,220 | $90 |
| 2023 | $3,216 | $15,579 | $15,500 | $79 |
| 2022 | $3,216 | $15,579 | $15,500 | $79 |
| 2021 | $3,143 | $15,579 | $15,500 | $79 |
| 2020 | $1,542 | $6,899 | $6,820 | $79 |
| 2019 | $1,391 | $6,899 | $6,820 | $79 |
| 2018 | $1,367 | $6,899 | $6,820 | $79 |
| 2017 | $1,356 | $6,279 | $6,200 | $79 |
| 2016 | $1,262 | $6,279 | $6,200 | $79 |
| 2015 | $1,155 | $6,279 | $6,200 | $79 |
| 2014 | $1,054 | $5,659 | $5,580 | $79 |
| 2013 | $1,033 | $5,659 | $5,580 | $79 |
Source: Public Records
Map
Nearby Homes
- 4246 N Kimball Ave
- 3247 W Berteau Ave
- 4248 N Sawyer Ave
- 4155 N Bernard St Unit G
- 4130 N Kimball Ave Unit 3
- 3222 W Berteau Ave Unit 2
- 4322 N Kimball Ave
- 3311 W Belle Plaine Ave
- 4229 N Kedzie Ave
- 4231 N Kedzie Ave Unit 3E
- 4116 N Kedzie Ave
- 4141 N Kedzie Ave Unit 307
- 3223 W Belle Plaine Ave
- 4207 N Drake Ave
- 4203 N Drake Ave
- 4026 N Kimball Ave
- 4018 N Spaulding Ave Unit 2
- 4419 N Bernard St
- 4307 N Troy St Unit 1
- 3102 W Berteau Ave Unit 31023
- 3327 W Hutchinson St
- 3331 W Hutchinson St
- 3323 W Hutchinson St
- 3333 W Hutchinson St
- 3337 W Hutchinson St
- 331 W Hutchinson St
- 3321 W Hutchinson St
- 3339 W Hutchinson St
- 3317 W Hutchinson St
- 3328 W Berteau Ave
- 3324 W Berteau Ave
- 3330 W Berteau Ave
- 3315 W Hutchinson St
- 3343 W Hutchinson St
- 3322 W Berteau Ave
- 3330 W Hutchinson St Unit 3
- 3330 W Hutchinson St Unit 2
- 3330 W Hutchinson St Unit 1
- 3332 W Hutchinson St
- 3324 W Hutchinson St