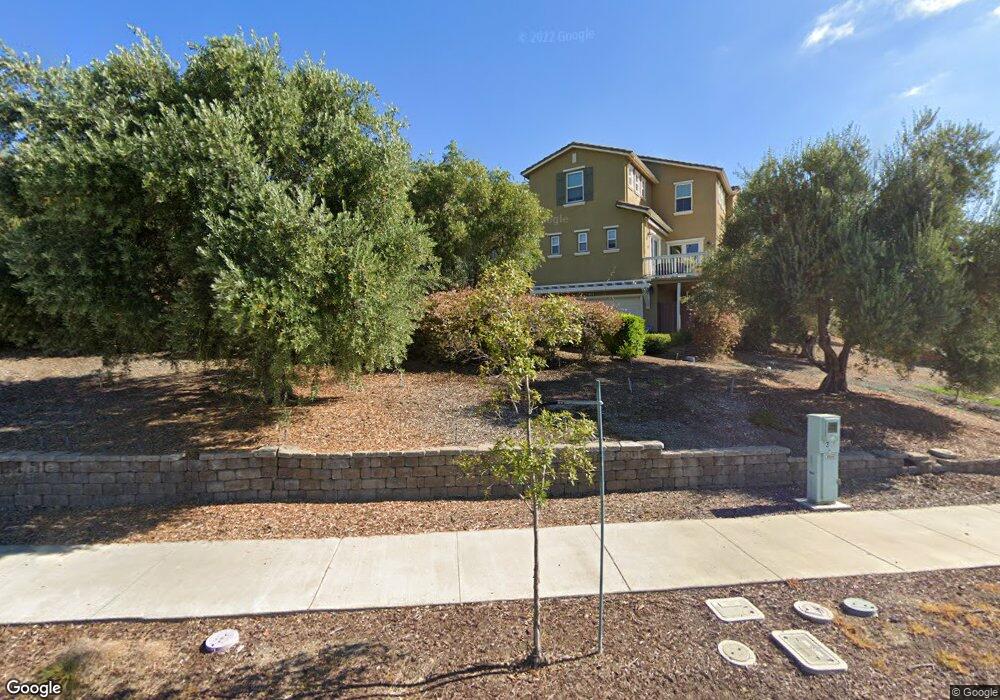
333 Ascente Commons San Jose, CA 95125
South San Jose NeighborhoodEstimated Value: $1,369,000 - $1,674,298
3
Beds
3
Baths
2,275
Sq Ft
$664/Sq Ft
Est. Value
About This Home
This home is located at 333 Ascente Commons, San Jose, CA 95125 and is currently estimated at $1,510,825, approximately $664 per square foot. 333 Ascente Commons is a home located in Santa Clara County with nearby schools including George Shirakawa Sr. Elementary School, Sylvandale Middle School, and Yerba Buena High School.
Ownership History
Date
Name
Owned For
Owner Type
Purchase Details
Closed on
Oct 27, 2005
Sold by
Pulte Home Corp
Bought by
Jeewanjee Zainuddean A and Jeewanjee Farzana Z
Current Estimated Value
Home Financials for this Owner
Home Financials are based on the most recent Mortgage that was taken out on this home.
Original Mortgage
$711,800
Interest Rate
6.07%
Mortgage Type
Negative Amortization
Create a Home Valuation Report for This Property
The Home Valuation Report is an in-depth analysis detailing your home's value as well as a comparison with similar homes in the area
Home Values in the Area
Average Home Value in this Area
Purchase History
| Date | Buyer | Sale Price | Title Company |
|---|---|---|---|
| Jeewanjee Zainuddean A | $890,000 | First American Title Company |
Source: Public Records
Mortgage History
| Date | Status | Borrower | Loan Amount |
|---|---|---|---|
| Previous Owner | Jeewanjee Zainuddean A | $711,800 |
Source: Public Records
Tax History
| Year | Tax Paid | Tax Assessment Tax Assessment Total Assessment is a certain percentage of the fair market value that is determined by local assessors to be the total taxable value of land and additions on the property. | Land | Improvement |
|---|---|---|---|---|
| 2025 | $17,512 | $1,215,835 | $546,628 | $669,207 |
| 2024 | $17,512 | $1,191,996 | $535,910 | $656,086 |
| 2023 | $17,268 | $1,168,624 | $525,402 | $643,222 |
| 2022 | $16,794 | $1,145,710 | $515,100 | $630,610 |
| 2021 | $16,758 | $1,123,246 | $505,000 | $618,246 |
| 2020 | $16,196 | $1,111,729 | $499,822 | $611,907 |
| 2019 | $15,516 | $1,089,931 | $490,022 | $599,909 |
| 2018 | $15,529 | $1,068,561 | $480,414 | $588,147 |
| 2017 | $13,227 | $888,000 | $399,200 | $488,800 |
| 2016 | $11,959 | $819,000 | $368,200 | $450,800 |
| 2015 | $11,922 | $818,000 | $367,800 | $450,200 |
| 2014 | $10,252 | $714,000 | $321,000 | $393,000 |
Source: Public Records
Map
Nearby Homes
- 2189 Pomme Ct
- 215 Olive Hill Dr
- 471 Mill Pond Dr Unit 471
- 353 Mill Pond Dr Unit 353
- 363 Bella Ridge Terrace
- 485 Mill Pond Dr Unit 485
- 499 Mill Pond Dr Unit 499
- 556 Mill Pond Dr Unit 556
- 337 Mill Pond Dr Unit 337
- 532A Mill Pond Dr Unit 532 A
- 317 Perrymont Ave
- 1850 Evans Ln Unit 65
- 1850 Evans Ln
- 267 Chateau La Salle Dr Unit 267
- 501 Sanger Way
- 751 Altino Blvd
- 2150 Almaden Rd Unit 113
- 2150 Almaden Rd Unit 147
- 2150 Almaden Rd Unit 73
- 401 Chateau La Salle Dr Unit 401
- 331 Ascente Commons
- 335 Ascente Commons
- 327 Ascente Commons
- 293 Ascente Commons
- 289 Ascente Commons
- 297 Ascente Commons
- 285 Ascente Commons
- 323 Ascente Commons
- 376 Ascente Commons
- 281 Ascente Commons
- 370 Ascente Commons
- 2346 Plateau Dr
- 2338 Plateau Dr
- 2350 Plateau Dr
- 2334 Plateau Dr
- 2330 Plateau Dr
- 320 Ascente Commons
- 270 Ascente Commons
- 360 Ascente Commons
- 316 Ascente Commons
Your Personal Tour Guide
Ask me questions while you tour the home.