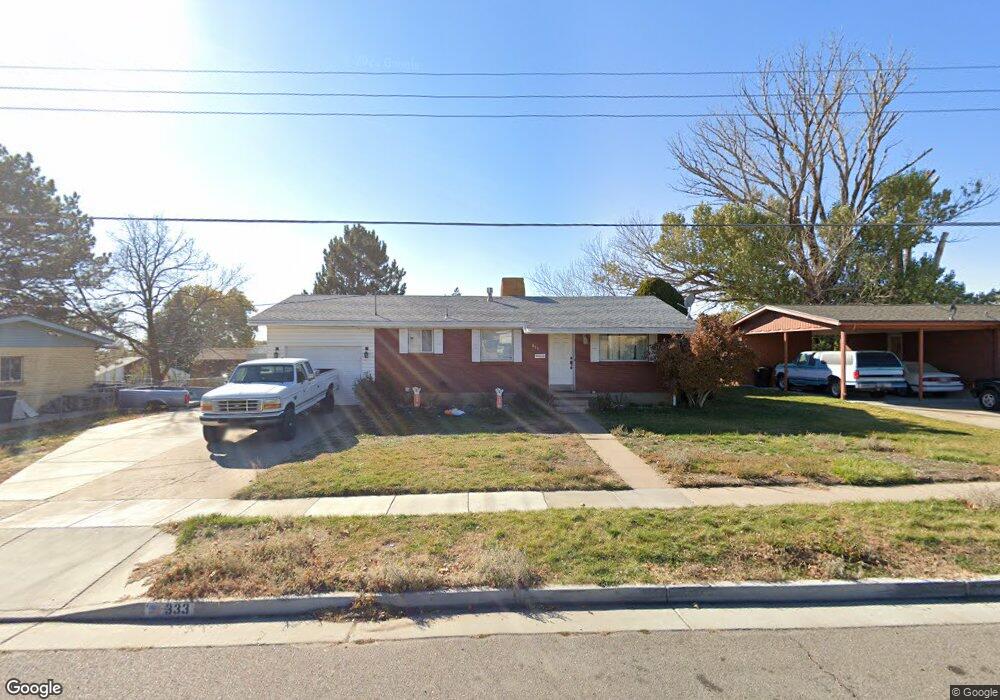
333 Bruce St Clearfield, UT 84015
Estimated Value: $356,000 - $411,000
3
Beds
2
Baths
1,934
Sq Ft
$199/Sq Ft
Est. Value
About This Home
This home is located at 333 Bruce St, Clearfield, UT 84015 and is currently estimated at $384,370, approximately $198 per square foot. 333 Bruce St is a home located in Davis County with nearby schools including Wasatch Elementary School, North Davis Junior High School, and Clearfield High School.
Ownership History
Date
Name
Owned For
Owner Type
Purchase Details
Closed on
Oct 3, 2025
Sold by
Davis And Weber Counties Canal Company
Bought by
Davis And Weber Counties Canal Company
Current Estimated Value
Purchase Details
Closed on
Mar 12, 2020
Sold by
Mcfarland Katherine E
Bought by
Bartunek Alica L and Bartunek Zachary S
Home Financials for this Owner
Home Financials are based on the most recent Mortgage that was taken out on this home.
Original Mortgage
$223,870
Interest Rate
3.75%
Mortgage Type
FHA
Create a Home Valuation Report for This Property
The Home Valuation Report is an in-depth analysis detailing your home's value as well as a comparison with similar homes in the area
Home Values in the Area
Average Home Value in this Area
Purchase History
| Date | Buyer | Sale Price | Title Company |
|---|---|---|---|
| Davis And Weber Counties Canal Company | -- | None Listed On Document | |
| Bartunek Alica L | -- | Vanguard Title Ins |
Source: Public Records
Mortgage History
| Date | Status | Borrower | Loan Amount |
|---|---|---|---|
| Previous Owner | Bartunek Alica L | $223,870 |
Source: Public Records
Tax History Compared to Growth
Tax History
| Year | Tax Paid | Tax Assessment Tax Assessment Total Assessment is a certain percentage of the fair market value that is determined by local assessors to be the total taxable value of land and additions on the property. | Land | Improvement |
|---|---|---|---|---|
| 2025 | $2,222 | $199,100 | $72,885 | $126,215 |
| 2024 | $2,151 | $194,150 | $69,677 | $124,473 |
| 2023 | $1,998 | $331,000 | $111,447 | $219,553 |
| 2022 | $2,007 | $179,850 | $63,875 | $115,975 |
| 2021 | $1,839 | $249,000 | $68,064 | $180,936 |
| 2020 | $1,435 | $193,000 | $58,200 | $134,800 |
| 2019 | $1,416 | $188,000 | $60,541 | $127,459 |
| 2018 | $1,260 | $163,000 | $51,049 | $111,951 |
| 2016 | $167 | $73,975 | $21,509 | $52,466 |
| 2015 | $1,028 | $66,275 | $21,509 | $44,766 |
| 2014 | $141 | $63,303 | $21,509 | $41,794 |
| 2013 | -- | $57,378 | $28,966 | $28,412 |
Source: Public Records
Map
Nearby Homes
- 268 N 300 E
- 186 Sycamore Cir
- 230 S Lakeview Dr
- 328 E 100 N
- 121 S Lakeview Dr
- 131 N Terrace Dr
- 111 Center St Unit 6A
- 111 Center St Unit 3B
- 80 S 400 E
- 98 S 350 E
- 54 W 250 N
- 75 W 250 N Unit 93
- 75 W 250 N Unit 12
- 75 W 250 N Unit 84
- 75 W 250 N Unit 110
- 75 W 250 N Unit 56
- 75 W 250 N Unit 37
- 75 W 250 N Unit 105
- 137 W 250 N
- 158 S Bushnell Way