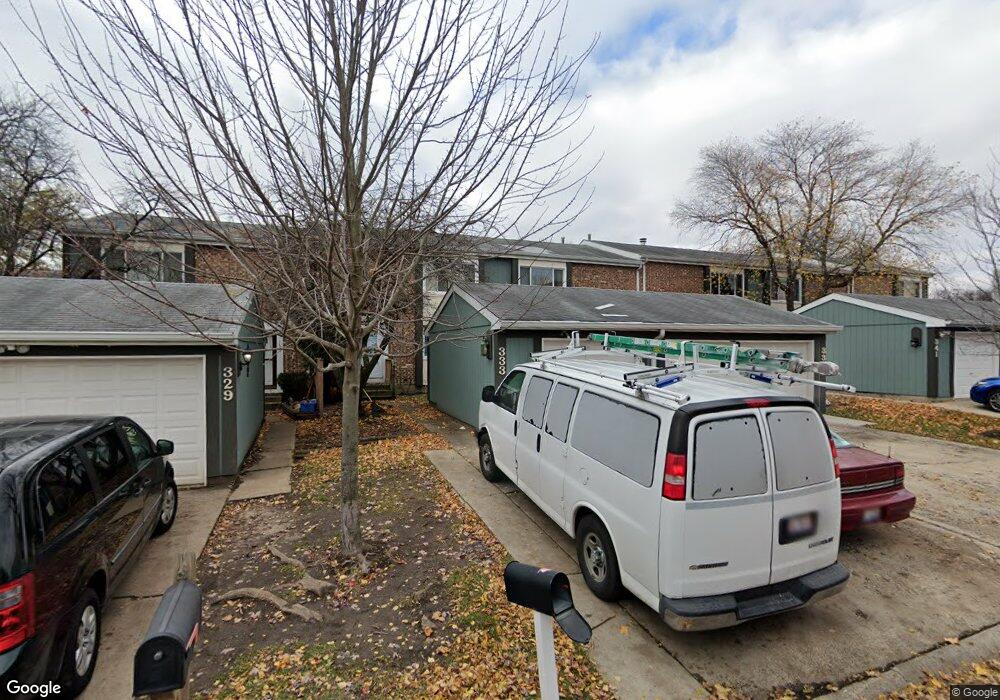
333 Dupage Dr Unit 5 Bolingbrook, IL 60440
East Bolingbrook NeighborhoodEstimated Value: $207,000 - $269,000
3
Beds
2
Baths
768
Sq Ft
$319/Sq Ft
Est. Value
About This Home
This home is located at 333 Dupage Dr Unit 5, Bolingbrook, IL 60440 and is currently estimated at $245,246, approximately $319 per square foot. 333 Dupage Dr Unit 5 is a home located in Will County with nearby schools including Oak View Elementary School, Bolingbrook High School, and Midwest Christian Montessori Academy.
Ownership History
Date
Name
Owned For
Owner Type
Purchase Details
Closed on
Aug 13, 2020
Sold by
Chicago Title Land Trust Company
Bought by
Delaquila Aura and Delaquila Rafael
Current Estimated Value
Purchase Details
Closed on
Dec 6, 2010
Sold by
Delaguila Aura M and Delaguila Rafael A
Bought by
Chicago Title Land Trust Company and Trust #8002354049
Purchase Details
Closed on
Jan 21, 2004
Sold by
Edom Ryan O and Edom Arlisa
Bought by
Anderson James and Anderson Shawnta
Home Financials for this Owner
Home Financials are based on the most recent Mortgage that was taken out on this home.
Original Mortgage
$113,050
Interest Rate
7.35%
Mortgage Type
Purchase Money Mortgage
Purchase Details
Closed on
Jan 28, 1995
Sold by
Anaya Armando and Anaya Sherry L
Bought by
Edom Ryan O
Home Financials for this Owner
Home Financials are based on the most recent Mortgage that was taken out on this home.
Original Mortgage
$82,000
Interest Rate
8.55%
Mortgage Type
Assumption
Create a Home Valuation Report for This Property
The Home Valuation Report is an in-depth analysis detailing your home's value as well as a comparison with similar homes in the area
Home Values in the Area
Average Home Value in this Area
Purchase History
| Date | Buyer | Sale Price | Title Company |
|---|---|---|---|
| Delaquila Aura | -- | Chicago Title Land Trust Co | |
| Chicago Title Land Trust Company | -- | None Available | |
| Delaguila Aura M | $59,156 | First American Title | |
| Anderson James | $133,000 | Ticor Title Insurance Compan | |
| Edom Ryan O | $82,000 | Chicago Title Insurance Co |
Source: Public Records
Mortgage History
| Date | Status | Borrower | Loan Amount |
|---|---|---|---|
| Previous Owner | Anderson James | $113,050 | |
| Previous Owner | Edom Ryan O | $82,000 | |
| Closed | Anderson James | $13,300 |
Source: Public Records
Tax History Compared to Growth
Tax History
| Year | Tax Paid | Tax Assessment Tax Assessment Total Assessment is a certain percentage of the fair market value that is determined by local assessors to be the total taxable value of land and additions on the property. | Land | Improvement |
|---|---|---|---|---|
| 2024 | $6,520 | $78,594 | $8,587 | $70,007 |
| 2023 | $6,520 | $70,716 | $7,726 | $62,990 |
| 2022 | $5,709 | $63,754 | $6,965 | $56,789 |
| 2021 | $5,222 | $57,874 | $6,322 | $51,552 |
| 2020 | $4,890 | $54,341 | $5,936 | $48,405 |
| 2019 | $4,515 | $49,763 | $5,436 | $44,327 |
| 2018 | $3,864 | $43,205 | $4,720 | $38,485 |
| 2017 | $3,459 | $39,003 | $4,261 | $34,742 |
| 2016 | $3,189 | $35,700 | $3,900 | $31,800 |
| 2015 | $2,929 | $33,200 | $3,600 | $29,600 |
| 2014 | $2,929 | $33,200 | $3,600 | $29,600 |
| 2013 | $2,929 | $33,200 | $3,600 | $29,600 |
Source: Public Records
Map
Nearby Homes
- 316 Pueblo Dr
- 621 Sundance Dr
- 228 Elkhorn Ct Unit B
- 329 Redwing Dr
- 261 Bryant Way
- 208 Flagstaff Dr
- 534 Cottonwood Cir
- 352 Gehrig Cir
- VACANT W Boughton Rd
- 412 Clifton Ln
- 565 Cottonwood Cir
- 623 Cochise Cir
- 353 Foster Way Unit 2
- 141 N Lancaster Dr
- 11 Roanoke Ct
- 267 Clarendon Ln Unit 1
- 3 Roanoke Ct
- 23 Wildwood Ln Unit G
- 117 Galewood Dr
- 8 Wildwood Ln Unit G
- 337 Dupage Dr
- 329 Dupage Dr
- 341 Dupage Dr
- 325 Dupage Dr
- 345 Dupage Dr
- 349 Dupage Dr
- 522 Sundance Dr
- 353 Dupage Dr
- 526 Sundance Dr
- 530 Sundance Dr
- 373 Dupage Dr
- 509 Sundance Dr Unit 5
- 513 Sundance Dr
- 505 Sundance Dr
- 517 Sundance Dr
- 501 Sundance Dr
- 534 Sundance Dr
- 521 Sundance Dr
- 377 Dupage Dr
- 9999 Confidential Rd