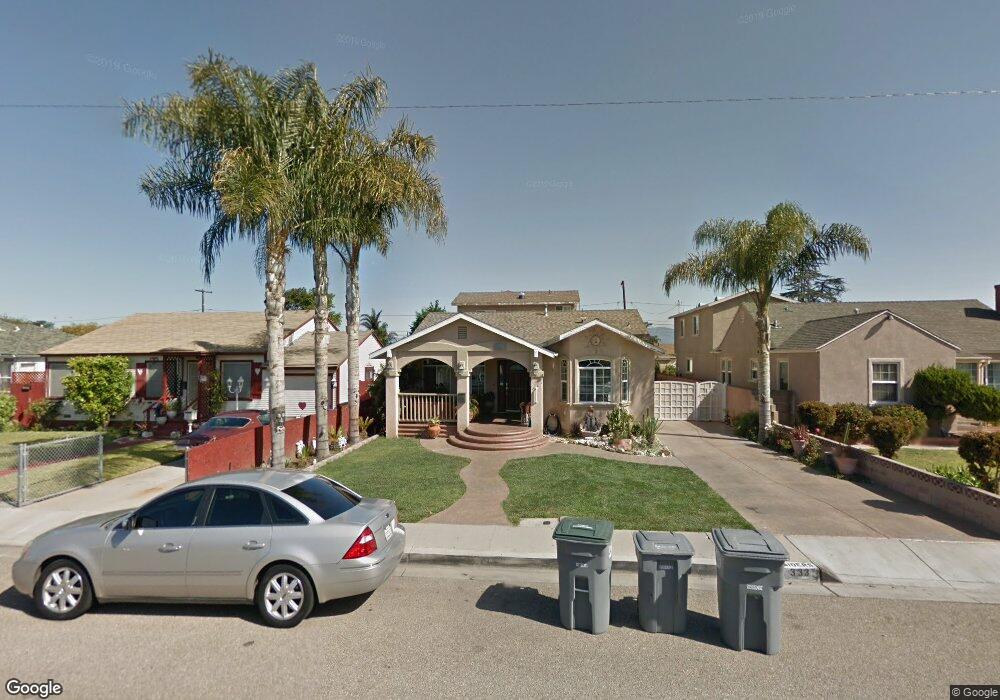
333 E Date St Oxnard, CA 93033
Cal-Gisler NeighborhoodEstimated Value: $535,000 - $799,985
4
Beds
2
Baths
2,225
Sq Ft
$306/Sq Ft
Est. Value
About This Home
This home is located at 333 E Date St, Oxnard, CA 93033 and is currently estimated at $681,246, approximately $306 per square foot. 333 E Date St is a home located in Ventura County with nearby schools including Elm Street Elementary School, R.J. Frank Academy of Marine Science & Engineering, and Santa Clara High School.
Ownership History
Date
Name
Owned For
Owner Type
Purchase Details
Closed on
Nov 15, 2023
Sold by
Rios Antonia and Rios Sergio
Bought by
Antonia Rios Living Trust and Rios
Current Estimated Value
Purchase Details
Closed on
Jan 18, 2008
Sold by
Rios Jesus and Rios Antonia
Bought by
Rios Antonia and Rios Sergio
Create a Home Valuation Report for This Property
The Home Valuation Report is an in-depth analysis detailing your home's value as well as a comparison with similar homes in the area
Home Values in the Area
Average Home Value in this Area
Purchase History
| Date | Buyer | Sale Price | Title Company |
|---|---|---|---|
| Antonia Rios Living Trust | -- | None Listed On Document | |
| Rios Antonia | -- | Fidelity National Title | |
| Rios Antonia | -- | Fidelity National Title |
Source: Public Records
Tax History
| Year | Tax Paid | Tax Assessment Tax Assessment Total Assessment is a certain percentage of the fair market value that is determined by local assessors to be the total taxable value of land and additions on the property. | Land | Improvement |
|---|---|---|---|---|
| 2025 | $4,488 | $375,247 | $183,958 | $191,289 |
| 2024 | $4,488 | $367,890 | $180,351 | $187,539 |
| 2023 | $4,324 | $360,677 | $176,815 | $183,862 |
| 2022 | $4,192 | $353,605 | $173,348 | $180,257 |
| 2021 | $4,157 | $346,672 | $169,949 | $176,723 |
| 2020 | $4,233 | $343,119 | $168,207 | $174,912 |
| 2019 | $4,113 | $336,392 | $164,909 | $171,483 |
| 2018 | $4,054 | $329,797 | $161,676 | $168,121 |
| 2017 | $3,847 | $323,331 | $158,506 | $164,825 |
| 2016 | $3,711 | $316,993 | $155,399 | $161,594 |
| 2015 | $3,749 | $312,234 | $153,066 | $159,168 |
| 2014 | $3,707 | $306,120 | $150,069 | $156,051 |
Source: Public Records
Map
Nearby Homes
- 225 W Iris St
- 1239 S C St
- 1127 S C St
- 2024 S J St
- 865 S B St Unit Q1
- 819 S B St Unit 34
- 633 Meta St
- 2151 E Wooley Rd
- 1030 Ilena St
- 3151 Fournier St
- 3130 Paula St
- 603 S G St
- 550 S G St
- 807 Kingfisher Way
- 1174 Oyster Place Unit 15
- 3631 La Costa Place
- 1431 Casa San Carlos Ln Unit B
- 403 E 2nd St
- 3638 S B St
- 1501 Pisco Ln
Your Personal Tour Guide
Ask me questions while you tour the home.