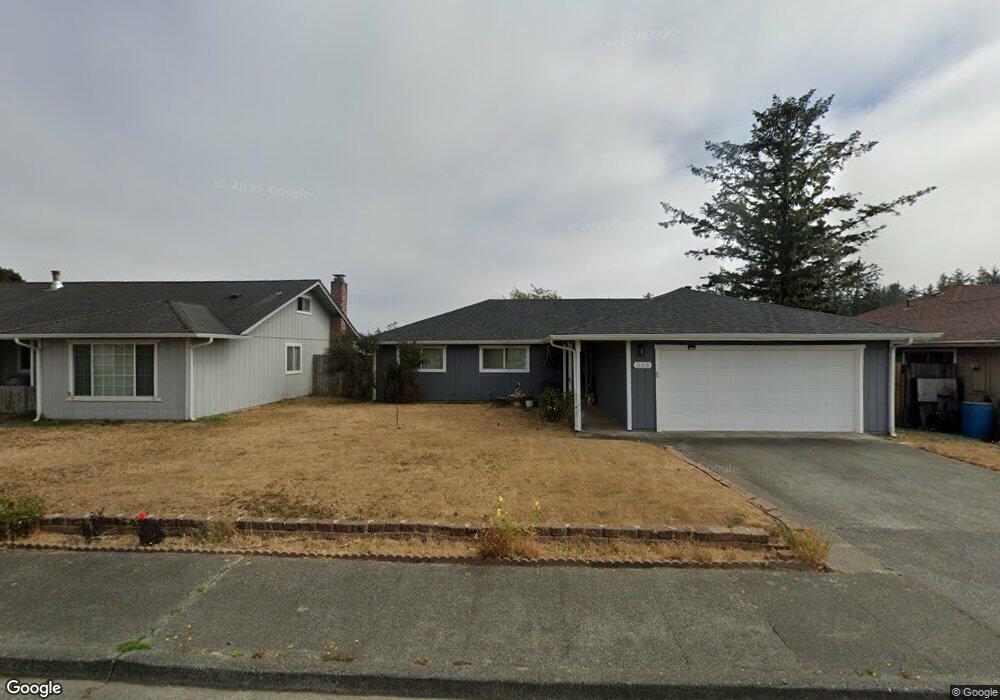
333 Grant Ave Crescent City, CA 95531
Estimated Value: $340,000 - $373,000
3
Beds
2
Baths
1,780
Sq Ft
$202/Sq Ft
Est. Value
About This Home
This home is located at 333 Grant Ave, Crescent City, CA 95531 and is currently estimated at $359,141, approximately $201 per square foot. 333 Grant Ave is a home located in Del Norte County with nearby schools including Bess Maxwell Elementary School, Crescent Elk Middle School, and Del Norte High School.
Ownership History
Date
Name
Owned For
Owner Type
Purchase Details
Closed on
Mar 14, 2024
Sold by
Vannocker Carolyn
Bought by
Carolyn A Van Nocker Revocable 2024 Trust and Van Nocker
Current Estimated Value
Purchase Details
Closed on
Feb 18, 2014
Sold by
Vannocker Anthony and Vannocker Carolyn
Bought by
Vannocker Anthony and Vannocker Van Nocker
Home Financials for this Owner
Home Financials are based on the most recent Mortgage that was taken out on this home.
Original Mortgage
$166,592
Interest Rate
4.47%
Mortgage Type
FHA
Create a Home Valuation Report for This Property
The Home Valuation Report is an in-depth analysis detailing your home's value as well as a comparison with similar homes in the area
Home Values in the Area
Average Home Value in this Area
Purchase History
| Date | Buyer | Sale Price | Title Company |
|---|---|---|---|
| Carolyn A Van Nocker Revocable 2024 Trust | -- | None Listed On Document | |
| Vannocker Anthony | -- | Ticor Title Company Of Ca |
Source: Public Records
Mortgage History
| Date | Status | Borrower | Loan Amount |
|---|---|---|---|
| Previous Owner | Vannocker Anthony | $166,592 |
Source: Public Records
Tax History Compared to Growth
Tax History
| Year | Tax Paid | Tax Assessment Tax Assessment Total Assessment is a certain percentage of the fair market value that is determined by local assessors to be the total taxable value of land and additions on the property. | Land | Improvement |
|---|---|---|---|---|
| 2025 | $1,893 | $191,854 | $44,843 | $147,011 |
| 2024 | $1,893 | $188,093 | $43,964 | $144,129 |
| 2023 | $1,851 | $184,405 | $43,102 | $141,303 |
| 2022 | $1,811 | $180,790 | $42,257 | $138,533 |
| 2021 | $1,798 | $177,246 | $41,429 | $135,817 |
| 2020 | $1,785 | $175,430 | $41,005 | $134,425 |
| 2019 | $1,754 | $171,991 | $40,201 | $131,790 |
| 2018 | $1,716 | $168,619 | $39,413 | $129,206 |
| 2017 | $1,687 | $165,314 | $38,641 | $126,673 |
| 2016 | $1,655 | $162,074 | $37,884 | $124,190 |
| 2015 | $1,616 | $159,640 | $37,315 | $122,325 |
| 2014 | $1,599 | $156,514 | $36,585 | $119,929 |
Source: Public Records
Map
Nearby Homes
- 373 Grant Ave
- 145 Mason Ct
- 227 Ruchong Ln
- 1210 Douglas St
- 724 Butte St
- 1102 Burtschell St
- 120 W Coolidge Ave
- 545 Reddy Ave
- 306 Butte St
- 650 E Washington Blvd
- 650 E Washington Blvd Unit Crescent Senior Mobi
- 275 E MacKen Ave
- 1329 Burtschell Place
- 1102 K St
- 494 Cooper Ave
- 125 W Washington Blvd
- 1150 9th St
- 696 Cooper Ave
- 1093
- 0000 E Washington Blvd
- 355 Grant Ave
- 319 Grant Ave
- 301 Grant Ave
- 500 Grant Ave
- 495 Grant Ave
- 391 Grant Ave
- 510 Grant Ave
- 1100 Oregon St
- 1110 Oregon St
- 442 Grant
- 1120 Oregon St
- 303 E Harding Ave
- 1130 Oregon St
- 1113 California St
- 1281 Douglas St
- 1121 California St
- 400 E Cooper Ave
- 400 E Cooper Ave
- 1129 California St
- 1105 California St