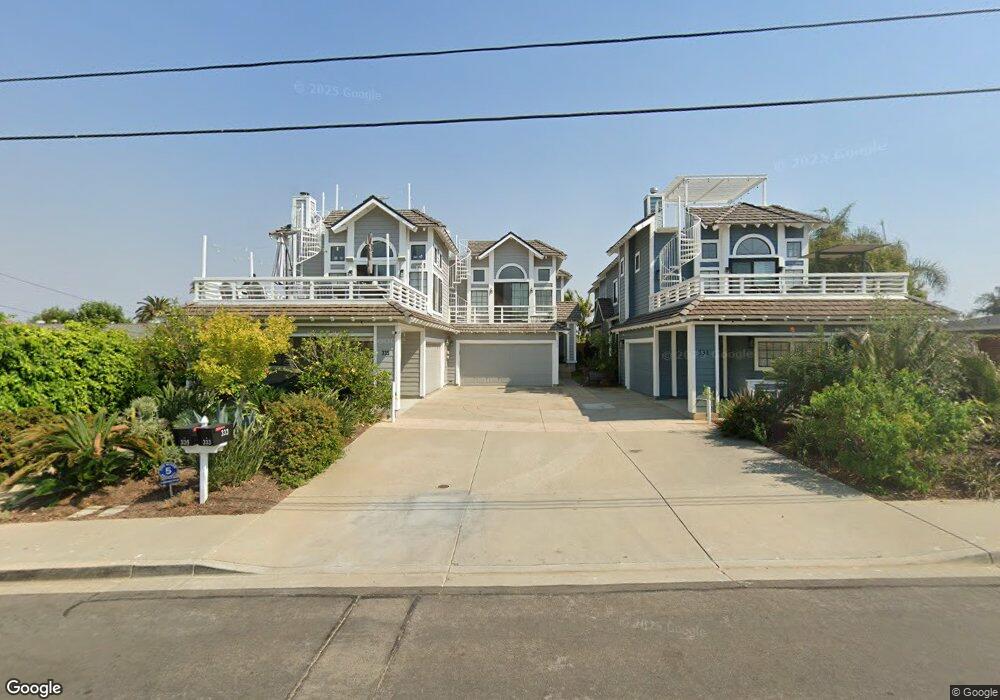
333 Hemlock Ave Carlsbad, CA 92008
North Beach NeighborhoodEstimated Value: $1,327,000 - $2,084,000
3
Beds
3
Baths
2,002
Sq Ft
$864/Sq Ft
Est. Value
About This Home
This home is located at 333 Hemlock Ave, Carlsbad, CA 92008 and is currently estimated at $1,730,523, approximately $864 per square foot. 333 Hemlock Ave is a home located in San Diego County with nearby schools including Carlsbad High School, Sage Creek High, and St. Patrick Catholic School.
Ownership History
Date
Name
Owned For
Owner Type
Purchase Details
Closed on
Aug 24, 2004
Sold by
Chaney Donald and Chaney Louisa
Bought by
Chaney Donald and Chaney Louisa
Current Estimated Value
Purchase Details
Closed on
Jan 2, 2002
Sold by
Chaney Louisa M
Bought by
Chaney Louisa M
Home Financials for this Owner
Home Financials are based on the most recent Mortgage that was taken out on this home.
Original Mortgage
$196,000
Outstanding Balance
$78,326
Interest Rate
6.73%
Mortgage Type
Purchase Money Mortgage
Estimated Equity
$1,652,197
Purchase Details
Closed on
Nov 2, 2000
Sold by
Chaney Louisa M
Bought by
Chaney Louisa M
Purchase Details
Closed on
May 21, 1998
Sold by
Hemlock 335
Bought by
Chaney Louisa M
Home Financials for this Owner
Home Financials are based on the most recent Mortgage that was taken out on this home.
Original Mortgage
$200,000
Interest Rate
7.17%
Mortgage Type
Purchase Money Mortgage
Create a Home Valuation Report for This Property
The Home Valuation Report is an in-depth analysis detailing your home's value as well as a comparison with similar homes in the area
Home Values in the Area
Average Home Value in this Area
Purchase History
| Date | Buyer | Sale Price | Title Company |
|---|---|---|---|
| Chaney Donald | -- | -- | |
| Chaney Donald | -- | -- | |
| Chaney Louisa M | -- | North American Title Co | |
| Chaney Louisa M | -- | -- | |
| Chaney Louisa M | $345,000 | -- | |
| Hemlock 335 | -- | South Coast Title Company |
Source: Public Records
Mortgage History
| Date | Status | Borrower | Loan Amount |
|---|---|---|---|
| Open | Chaney Louisa M | $196,000 | |
| Closed | Chaney Louisa M | $200,000 |
Source: Public Records
Tax History
| Year | Tax Paid | Tax Assessment Tax Assessment Total Assessment is a certain percentage of the fair market value that is determined by local assessors to be the total taxable value of land and additions on the property. | Land | Improvement |
|---|---|---|---|---|
| 2025 | $5,704 | $550,854 | $239,503 | $311,351 |
| 2024 | $5,704 | $540,054 | $234,807 | $305,247 |
| 2023 | $5,673 | $529,465 | $230,203 | $299,262 |
| 2022 | $5,584 | $519,085 | $225,690 | $293,395 |
| 2021 | $5,541 | $508,908 | $221,265 | $287,643 |
| 2020 | $5,503 | $503,691 | $218,997 | $284,694 |
| 2019 | $5,402 | $493,815 | $214,703 | $279,112 |
| 2018 | $5,187 | $484,134 | $210,494 | $273,640 |
| 2017 | $5,160 | $474,642 | $206,367 | $268,275 |
| 2016 | $4,963 | $465,336 | $202,321 | $263,015 |
| 2015 | $4,933 | $458,347 | $199,282 | $259,065 |
| 2014 | $4,776 | $449,370 | $195,379 | $253,991 |
Source: Public Records
Map
Nearby Homes
- 368 Hemlock Ave
- 385 Juniper Ave
- 370 Tamarack Ave
- 256 Juniper Ave Unit B6
- 160 Hemlock Ave
- 3865 Hibiscus Cir
- 150 Juniper Ave
- 187 Cherry Ave
- 324 Chinquapin Ave
- 320 Chinquapin Ave
- 141 Cherry Ave
- 334 Date Ave
- 157 Maple Ave
- 4007 Canario St Unit E
- 801 Kalpati Cir Unit B
- 4020 Layang Cir Unit C
- 809 Kalpati Cir Unit 323
- 4021 Layang Cir Unit A
- 3258 Tyler St
- 3747 Adams St
- 331 Hemlock Ave Unit U3
- 335 Hemlock Ave Unit U1
- 315 Hemlock Ave
- 355 Hemlock Ave
- 330 Redwood Ave
- 320 Redwood Ave
- 350 Redwood Ave
- 363 Hemlock Ave
- 363 Hemlock Ave Unit C
- 363 Hemlock Ave Unit B
- 363 Hemlock Ave Unit A
- 305 Hemlock Ave
- 318 Hemlock Ave
- 316 Hemlock Ave
- 300 Redwood Ave
- 330 Hemlock Ave
- 330 Hemlock Ave
- 365 Hemlock Ave Unit E
- 365 Hemlock Ave Unit D
- 365 Hemlock Ave Unit C