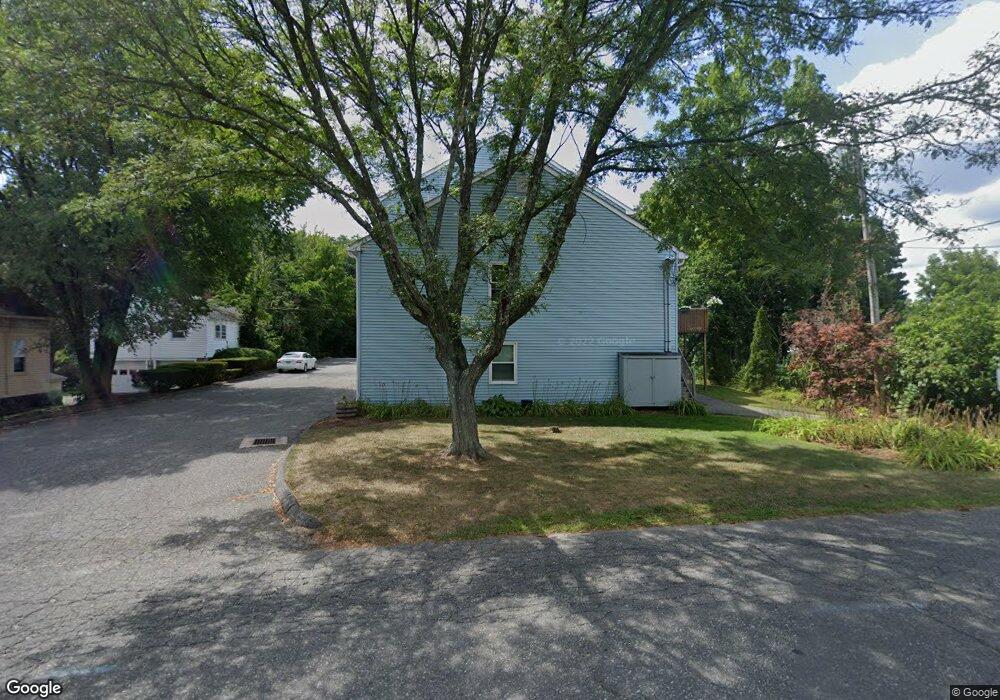
333 Hillside Ave Unit B4 Torrington, CT 06790
Estimated Value: $168,000 - $195,000
2
Beds
1
Bath
999
Sq Ft
$179/Sq Ft
Est. Value
About This Home
This home is located at 333 Hillside Ave Unit B4, Torrington, CT 06790 and is currently estimated at $178,515, approximately $178 per square foot. 333 Hillside Ave Unit B4 is a home located in Litchfield County with nearby schools including Torrington Middle School, Torrington High School, and St. Peter School.
Ownership History
Date
Name
Owned For
Owner Type
Purchase Details
Closed on
Apr 11, 2016
Sold by
Gracie Wayne
Bought by
Gracie Wayne and Garofalo Tracy
Current Estimated Value
Purchase Details
Closed on
Oct 23, 2015
Sold by
Midfirst Bank
Bought by
Department Of Housing & Urban Dev
Purchase Details
Closed on
Oct 10, 2014
Sold by
Carlson Peggy
Bought by
Midfirst Bank
Purchase Details
Closed on
Sep 28, 2006
Sold by
Roman Richelle T
Bought by
Haas Jason and Carlson Peggy
Home Financials for this Owner
Home Financials are based on the most recent Mortgage that was taken out on this home.
Original Mortgage
$116,669
Interest Rate
6.52%
Purchase Details
Closed on
Aug 1, 2003
Sold by
Ferrentino E Ruth
Bought by
Roman Richelle T
Create a Home Valuation Report for This Property
The Home Valuation Report is an in-depth analysis detailing your home's value as well as a comparison with similar homes in the area
Home Values in the Area
Average Home Value in this Area
Purchase History
| Date | Buyer | Sale Price | Title Company |
|---|---|---|---|
| Gracie Wayne | -- | -- | |
| Gracie Wayne | $32,000 | -- | |
| Department Of Housing & Urban Dev | -- | -- | |
| Midfirst Bank | -- | -- | |
| Haas Jason | $118,500 | -- | |
| Roman Richelle T | $82,000 | -- |
Source: Public Records
Mortgage History
| Date | Status | Borrower | Loan Amount |
|---|---|---|---|
| Previous Owner | Roman Richelle T | $112,128 | |
| Previous Owner | Roman Richelle T | $116,669 | |
| Previous Owner | Roman Richelle T | $4,300 |
Source: Public Records
Tax History Compared to Growth
Tax History
| Year | Tax Paid | Tax Assessment Tax Assessment Total Assessment is a certain percentage of the fair market value that is determined by local assessors to be the total taxable value of land and additions on the property. | Land | Improvement |
|---|---|---|---|---|
| 2025 | $4,522 | $117,600 | $0 | $117,600 |
| 2024 | $2,379 | $49,600 | $0 | $49,600 |
| 2023 | $2,379 | $49,600 | $0 | $49,600 |
| 2022 | $2,338 | $49,600 | $0 | $49,600 |
| 2021 | $2,290 | $49,600 | $0 | $49,600 |
| 2020 | $2,290 | $49,600 | $0 | $49,600 |
| 2019 | $2,215 | $47,970 | $0 | $47,970 |
| 2018 | $2,215 | $47,970 | $0 | $47,970 |
| 2017 | $2,195 | $47,970 | $0 | $47,970 |
| 2016 | $2,195 | $47,970 | $0 | $47,970 |
| 2015 | $2,195 | $47,970 | $0 | $47,970 |
| 2014 | $2,475 | $68,150 | $0 | $68,150 |
Source: Public Records
Map
Nearby Homes
- 333 Hillside Ave Unit 10
- 185 Barton St
- 187 Hillside Ave
- 148 Hillside Ave
- 19 Harwinton Ave
- 184 Harwinton Ave
- 91 Harrison Ave
- 63 Barbero Dr
- 71 Tognalli Dr
- 165 Birchwood Dr
- 119 Tognalli Dr
- 291 E Main St
- 25 Lipton Place
- 528 Clearview Ave
- 48 Brookside Ave
- 505 Harwinton Ave Unit 21
- 505 Harwinton Ave Unit 27
- 636 E Main St
- 29 Hannah Way
- 107 E Pearl St
- 333 Hillside Ave Unit A8
- 333 Hillside Ave Unit A12
- 333 Hillside Ave Unit B1
- 333 Hillside Ave Unit A10
- 333 Hillside Ave Unit A5
- 333 Hillside Ave Unit B3
- 333 Hillside Ave Unit A7
- 333 Hillside Ave Unit A11
- 333 Hillside Ave Unit A9
- 333 Hillside Ave Unit B2
- 333 Hillside Ave Unit A6
- 333 Hillside Ave Unit 8
- 333 Hillside Ave Unit 5
- 333 Hillside Ave Unit 4
- 333 Hillside Ave Unit 7
- 325 Hillside Ave
- 349 Hillside Ave
- 326 Hillside Ave
- 315 Hillside Ave