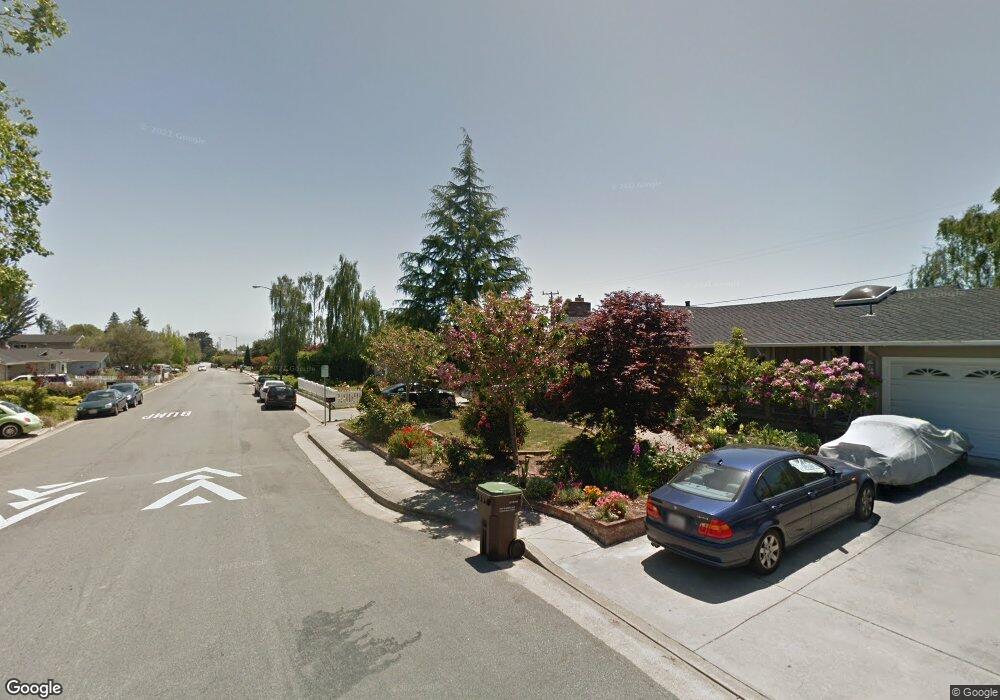
333 Moore St Santa Cruz, CA 95060
Westlake NeighborhoodEstimated Value: $1,618,379 - $1,838,000
3
Beds
2
Baths
1,825
Sq Ft
$951/Sq Ft
Est. Value
About This Home
This home is located at 333 Moore St, Santa Cruz, CA 95060 and is currently estimated at $1,735,095, approximately $950 per square foot. 333 Moore St is a home located in Santa Cruz County with nearby schools including Westlake Elementary School, Mission Hill Middle School, and Santa Cruz High School.
Ownership History
Date
Name
Owned For
Owner Type
Purchase Details
Closed on
May 9, 2007
Sold by
Pinther Steaphen S and The Steaphen S Pinther Living
Bought by
Wang Hongyun and Zhou Hong
Current Estimated Value
Home Financials for this Owner
Home Financials are based on the most recent Mortgage that was taken out on this home.
Original Mortgage
$535,000
Outstanding Balance
$325,424
Interest Rate
6.17%
Mortgage Type
Purchase Money Mortgage
Estimated Equity
$1,409,671
Purchase Details
Closed on
Mar 8, 2007
Sold by
Pollastrini Ken
Bought by
Pinther Steaphen S and The Steaphen S Pinther Living
Purchase Details
Closed on
Dec 14, 2006
Sold by
Pinther Steaphen S and Steaphen S Pinther Living Trus
Bought by
Pinther Steaphen S and Steaphen S Pinther Living Trus
Purchase Details
Closed on
Feb 17, 2004
Sold by
Pinther Steaphen S
Bought by
Pinther Steaphen S and The Steaphen S Pinther Living
Purchase Details
Closed on
Jan 11, 2001
Sold by
Pinther Deborah J
Bought by
Pinther Steaphen S
Home Financials for this Owner
Home Financials are based on the most recent Mortgage that was taken out on this home.
Original Mortgage
$343,750
Interest Rate
6.91%
Mortgage Type
Stand Alone First
Create a Home Valuation Report for This Property
The Home Valuation Report is an in-depth analysis detailing your home's value as well as a comparison with similar homes in the area
Home Values in the Area
Average Home Value in this Area
Purchase History
| Date | Buyer | Sale Price | Title Company |
|---|---|---|---|
| Wang Hongyun | $979,000 | First American Title Company | |
| Pinther Steaphen S | -- | First American Title Company | |
| Pinther Steaphen S | -- | None Available | |
| Pinther Steaphen S | -- | -- | |
| Pinther Steaphen S | -- | Old Republic Title Company |
Source: Public Records
Mortgage History
| Date | Status | Borrower | Loan Amount |
|---|---|---|---|
| Open | Wang Hongyun | $535,000 | |
| Previous Owner | Pinther Steaphen S | $343,750 |
Source: Public Records
Tax History Compared to Growth
Tax History
| Year | Tax Paid | Tax Assessment Tax Assessment Total Assessment is a certain percentage of the fair market value that is determined by local assessors to be the total taxable value of land and additions on the property. | Land | Improvement |
|---|---|---|---|---|
| 2025 | $14,352 | $1,311,658 | $904,362 | $407,296 |
| 2023 | $14,175 | $1,260,724 | $869,244 | $391,480 |
| 2022 | $14,012 | $1,236,004 | $852,200 | $383,804 |
| 2021 | $13,716 | $1,211,770 | $835,490 | $376,280 |
| 2020 | $13,607 | $1,199,346 | $826,924 | $372,422 |
| 2019 | $13,312 | $1,175,828 | $810,710 | $365,118 |
| 2018 | $13,158 | $1,152,772 | $794,812 | $357,960 |
| 2017 | $12,535 | $1,089,899 | $751,467 | $338,432 |
| 2016 | $11,192 | $1,009,166 | $695,802 | $313,364 |
| 2015 | $10,517 | $952,044 | $656,417 | $295,627 |
| 2014 | $9,516 | $857,697 | $591,366 | $266,331 |
Source: Public Records
Map
Nearby Homes
- 309 Village Cir
- 1212 Laurent St
- 623 High St
- 221 Segre Place
- 331 Van Ness Ave
- 449 High St
- 256 Segre Place
- 210 Moore Creek Rd
- 1310 Escalona Dr
- 514 Meder St
- 1459 High St
- 1103 Mission St
- 233 Rigg St
- 603 Mission St
- 1124 Laurel St
- 260 High St Unit 204
- 260 High St Unit 206
- 350 Highland Ave
- 1612 Escalona Dr
- 121 Acadia Ave