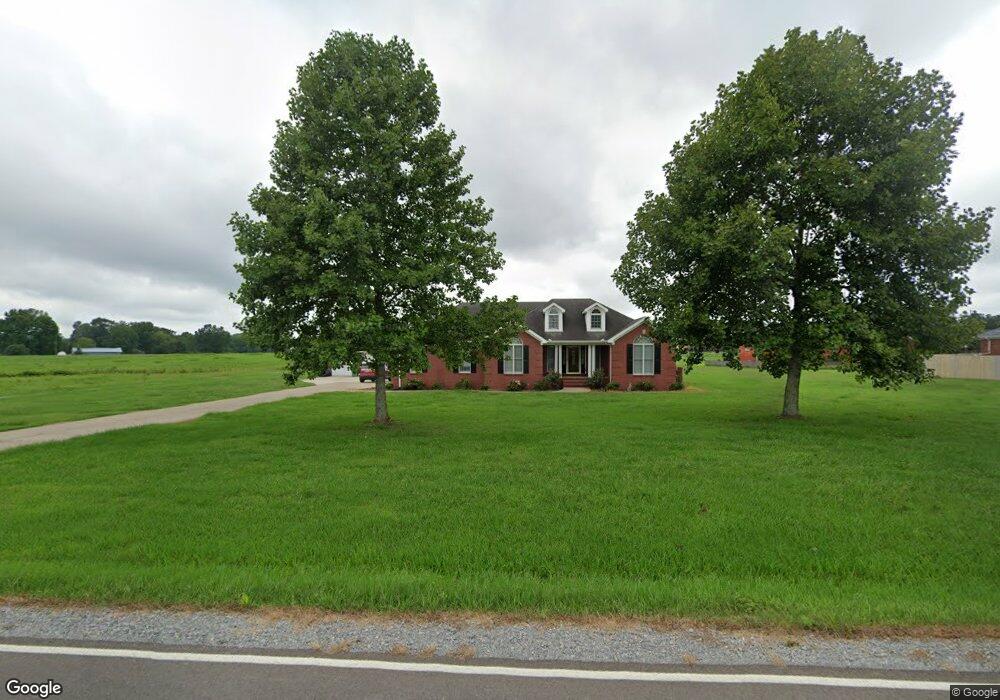
333 Patrick Rd Fayetteville, TN 37334
Estimated Value: $341,809 - $369,000
--
Bed
2
Baths
1,724
Sq Ft
$205/Sq Ft
Est. Value
About This Home
This home is located at 333 Patrick Rd, Fayetteville, TN 37334 and is currently estimated at $354,202, approximately $205 per square foot. 333 Patrick Rd is a home located in Lincoln County with nearby schools including South Lincoln School, Lincoln Central Academy, and Lincoln County High School.
Ownership History
Date
Name
Owned For
Owner Type
Purchase Details
Closed on
Jun 30, 2022
Sold by
Scott Bean and Scott James
Bought by
Lane Jeremiah Lane and Lane Maegan
Current Estimated Value
Home Financials for this Owner
Home Financials are based on the most recent Mortgage that was taken out on this home.
Original Mortgage
$319,113
Outstanding Balance
$304,016
Interest Rate
5.25%
Mortgage Type
FHA
Estimated Equity
$50,186
Purchase Details
Closed on
Apr 16, 1999
Sold by
Gardner Ted
Bought by
Gardner Ted and Gardner Shawn
Purchase Details
Closed on
Mar 28, 1996
Sold by
Gardner Ted
Bought by
Gardner Ted
Purchase Details
Closed on
Feb 20, 1996
Sold by
Gardner Ted
Bought by
Gardner Ted
Purchase Details
Closed on
Aug 23, 1995
Bought by
Charles Eakes
Purchase Details
Closed on
Feb 19, 1988
Bought by
Sabghi David
Create a Home Valuation Report for This Property
The Home Valuation Report is an in-depth analysis detailing your home's value as well as a comparison with similar homes in the area
Home Values in the Area
Average Home Value in this Area
Purchase History
| Date | Buyer | Sale Price | Title Company |
|---|---|---|---|
| Lane Jeremiah Lane | $325,000 | None Listed On Document | |
| Lane Jeremiah Lane | $325,000 | None Listed On Document | |
| Gardner Ted | -- | -- | |
| Gardner Ted | -- | -- | |
| Gardner Ted | -- | -- | |
| Gardner Ted | -- | -- | |
| Gardner Ted | $8,800 | -- | |
| Gardner Ted | $8,800 | -- | |
| Gardner Ted | $8,800 | -- | |
| Gardner Ted | $8,800 | -- | |
| Charles Eakes | $7,100 | -- | |
| Charles Eakes | $7,100 | -- | |
| Sabghi David | -- | -- | |
| Sabghi David | -- | -- |
Source: Public Records
Mortgage History
| Date | Status | Borrower | Loan Amount |
|---|---|---|---|
| Open | Lane Jeremiah Lane | $319,113 | |
| Closed | Lane Jeremiah Lane | $319,113 |
Source: Public Records
Tax History Compared to Growth
Tax History
| Year | Tax Paid | Tax Assessment Tax Assessment Total Assessment is a certain percentage of the fair market value that is determined by local assessors to be the total taxable value of land and additions on the property. | Land | Improvement |
|---|---|---|---|---|
| 2024 | $1,631 | $85,850 | $7,475 | $78,375 |
| 2023 | $1,583 | $54,925 | $4,250 | $50,675 |
| 2022 | $1,155 | $54,925 | $4,250 | $50,675 |
| 2021 | $1,155 | $54,925 | $4,250 | $50,675 |
| 2020 | $1,155 | $54,925 | $4,250 | $50,675 |
| 2019 | $1,155 | $54,925 | $4,250 | $50,675 |
| 2018 | $1,134 | $45,725 | $3,750 | $41,975 |
| 2017 | $1,070 | $45,725 | $3,750 | $41,975 |
| 2016 | $1,070 | $45,725 | $3,750 | $41,975 |
| 2015 | -- | $45,725 | $3,750 | $41,975 |
| 2014 | $896 | $45,725 | $3,750 | $41,975 |
Source: Public Records
Map
Nearby Homes
- 1 Roxey Dr
- 5 Boomer Ln
- 21 Eastridge Rd
- 105 Ashton Cir
- 0 Hilldale Church Rd
- 51 Eastridge Rd
- 61 Eastridge Rd
- 132 Ashton Cir
- 27 Hilldale Church Rd
- 14 S Patrick Rd
- 195 Patrick Rd
- 15 Oak Dr
- 21 Hancock Branch Dr
- Kerry Plan at Bailey Park
- Lakeside Plan at Bailey Park
- Aldridge Plan at Bailey Park
- Cali Plan at Bailey Park
- Freeport Plan at Bailey Park
- The Daphne E Plan at Bailey Park
- The Franklin D Plan at Bailey Park