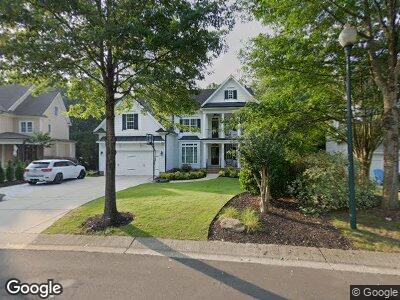
333 Stearns Way Wake Forest, NC 27587
Estimated Value: $782,434 - $931,000
4
Beds
4
Baths
3,454
Sq Ft
$246/Sq Ft
Est. Value
About This Home
This home is located at 333 Stearns Way, Wake Forest, NC 27587 and is currently estimated at $849,609, approximately $245 per square foot. 333 Stearns Way is a home located in Wake County with nearby schools including Heritage Elementary School, Heritage Middle School, and Heritage High School.
Ownership History
Date
Name
Owned For
Owner Type
Purchase Details
Closed on
Nov 16, 2009
Sold by
Bass Dawn N
Bought by
Baker Matthew J and Baker Tracy B
Current Estimated Value
Home Financials for this Owner
Home Financials are based on the most recent Mortgage that was taken out on this home.
Original Mortgage
$364,000
Interest Rate
4.94%
Mortgage Type
New Conventional
Purchase Details
Closed on
Jun 20, 2008
Sold by
Homes By Dickerson Inc
Bought by
Mccormack Todd D and Bass Dawn N
Home Financials for this Owner
Home Financials are based on the most recent Mortgage that was taken out on this home.
Original Mortgage
$294,000
Interest Rate
5.97%
Mortgage Type
Purchase Money Mortgage
Create a Home Valuation Report for This Property
The Home Valuation Report is an in-depth analysis detailing your home's value as well as a comparison with similar homes in the area
Home Values in the Area
Average Home Value in this Area
Purchase History
| Date | Buyer | Sale Price | Title Company |
|---|---|---|---|
| Baker Matthew J | $455,000 | None Available | |
| Mccormack Todd D | $490,000 | None Available |
Source: Public Records
Mortgage History
| Date | Status | Borrower | Loan Amount |
|---|---|---|---|
| Open | Baker Matthew J | $318,500 | |
| Closed | Baker Matthew J | $364,000 | |
| Previous Owner | Bass Dawn N | $295,500 | |
| Previous Owner | Mccormack Todd D | $294,000 |
Source: Public Records
Tax History Compared to Growth
Tax History
| Year | Tax Paid | Tax Assessment Tax Assessment Total Assessment is a certain percentage of the fair market value that is determined by local assessors to be the total taxable value of land and additions on the property. | Land | Improvement |
|---|---|---|---|---|
| 2024 | $6,807 | $714,134 | $130,000 | $584,134 |
| 2023 | $5,627 | $482,515 | $85,000 | $397,515 |
| 2022 | $5,398 | $482,515 | $85,000 | $397,515 |
| 2021 | $5,304 | $482,515 | $85,000 | $397,515 |
| 2020 | $5,304 | $482,515 | $85,000 | $397,515 |
| 2019 | $5,507 | $442,223 | $70,000 | $372,223 |
| 2018 | $5,213 | $433,993 | $70,000 | $363,993 |
| 2017 | $4,946 | $433,993 | $70,000 | $363,993 |
| 2016 | $4,883 | $433,993 | $70,000 | $363,993 |
| 2015 | $5,493 | $482,444 | $86,000 | $396,444 |
| 2014 | $5,317 | $482,444 | $86,000 | $396,444 |
Source: Public Records
Map
Nearby Homes
- 1324 Vanagrif Ct
- 1316 Plunket Dr
- 341 Hammond Oak Ln
- 1132 Heritage Knoll Dr
- 512 Hallburg Ct
- 518 Toran Dr
- 925 Hidden Jewel Ln
- 904 Hidden Jewel Ln
- 440 Golden Dragonfly St
- 1401 Brewer Jackson Ct
- 507 Gateway Townes Blvd
- 978 Gateway Commons Cir
- 503 Gateway Townes Blvd
- 432 Golden Dragonfly St
- 444 Golden Dragonfly St
- 452 Golden Dragonfly St
- 456 Golden Dragonfly St
- 448 Golden Dragonfly St
- 436 Golden Dragonfly St
- 1537 Heritage Club Ave
- 333 Stearns Way
- 337 Stearns Way
- 329 Stearns Way
- 1309 Heritage Hills Way
- 1313 Heritage Hills Way
- 1305 Heritage Hills Way
- 325 Stearns Way
- 1317 Heritage Hills Way
- 401 Vodin St
- 320 Stearns Way
- 405 Vodin St
- 316 Stearns Way
- 1321 Heritage Hills Way
- 321 Stearns Way
- 500 Walters Dr
- 409 Vodin St
- 1301 Heritage Hills Way
- 1325 Heritage Hills Way
- 312 Stearns Way
- 317 Stearns Way