333 Vincellette St Unit 112 Bridgeport, CT 06606
North End NeighborhoodEstimated Value: $206,000 - $264,000
1
Bed
1
Bath
918
Sq Ft
$246/Sq Ft
Est. Value
About This Home
This home is located at 333 Vincellette St Unit 112, Bridgeport, CT 06606 and is currently estimated at $226,066, approximately $246 per square foot. 333 Vincellette St Unit 112 is a home located in Fairfield County with nearby schools including John Winthrop School, Central High School, and St Andrew School.
Ownership History
Date
Name
Owned For
Owner Type
Purchase Details
Closed on
Feb 29, 2008
Sold by
Steese Matthew
Bought by
Smith Clive
Current Estimated Value
Home Financials for this Owner
Home Financials are based on the most recent Mortgage that was taken out on this home.
Original Mortgage
$146,800
Outstanding Balance
$91,748
Interest Rate
5.8%
Estimated Equity
$134,318
Purchase Details
Closed on
Jul 21, 2004
Sold by
Hendricks Deborah
Bought by
Steese Matthew
Home Financials for this Owner
Home Financials are based on the most recent Mortgage that was taken out on this home.
Original Mortgage
$81,000
Interest Rate
6.28%
Purchase Details
Closed on
Feb 26, 1998
Sold by
Kalman Abraham M and Kalman Sophie
Bought by
Hendricks Deborah
Purchase Details
Closed on
Feb 6, 1995
Sold by
Forman Sylvia
Bought by
Kalina Abraham M and Kalina Sophie
Create a Home Valuation Report for This Property
The Home Valuation Report is an in-depth analysis detailing your home's value as well as a comparison with similar homes in the area
Home Values in the Area
Average Home Value in this Area
Purchase History
| Date | Buyer | Sale Price | Title Company |
|---|---|---|---|
| Smith Clive | $149,000 | -- | |
| Smith Clive | $149,000 | -- | |
| Steese Matthew | $120,000 | -- | |
| Steese Matthew | $120,000 | -- | |
| Hendricks Deborah | $30,000 | -- | |
| Hendricks Deborah | $30,000 | -- | |
| Kalina Abraham M | $25,000 | -- | |
| Kalina Abraham M | $25,000 | -- |
Source: Public Records
Mortgage History
| Date | Status | Borrower | Loan Amount |
|---|---|---|---|
| Open | Kalina Abraham M | $146,800 | |
| Closed | Kalina Abraham M | $146,800 | |
| Previous Owner | Kalina Abraham M | $81,000 |
Source: Public Records
Tax History Compared to Growth
Tax History
| Year | Tax Paid | Tax Assessment Tax Assessment Total Assessment is a certain percentage of the fair market value that is determined by local assessors to be the total taxable value of land and additions on the property. | Land | Improvement |
|---|---|---|---|---|
| 2025 | $2,886 | $66,420 | $0 | $66,420 |
| 2024 | $2,886 | $66,420 | $0 | $66,420 |
| 2023 | $2,886 | $66,420 | $0 | $66,420 |
| 2022 | $2,886 | $66,420 | $0 | $66,420 |
| 2021 | $2,886 | $66,420 | $0 | $66,420 |
| 2020 | $2,863 | $53,030 | $0 | $53,030 |
| 2019 | $2,863 | $53,030 | $0 | $53,030 |
| 2018 | $2,883 | $53,030 | $0 | $53,030 |
| 2017 | $2,883 | $53,030 | $0 | $53,030 |
| 2016 | $2,883 | $53,030 | $0 | $53,030 |
| 2015 | $3,597 | $85,240 | $0 | $85,240 |
| 2014 | $3,597 | $85,240 | $0 | $85,240 |
Source: Public Records
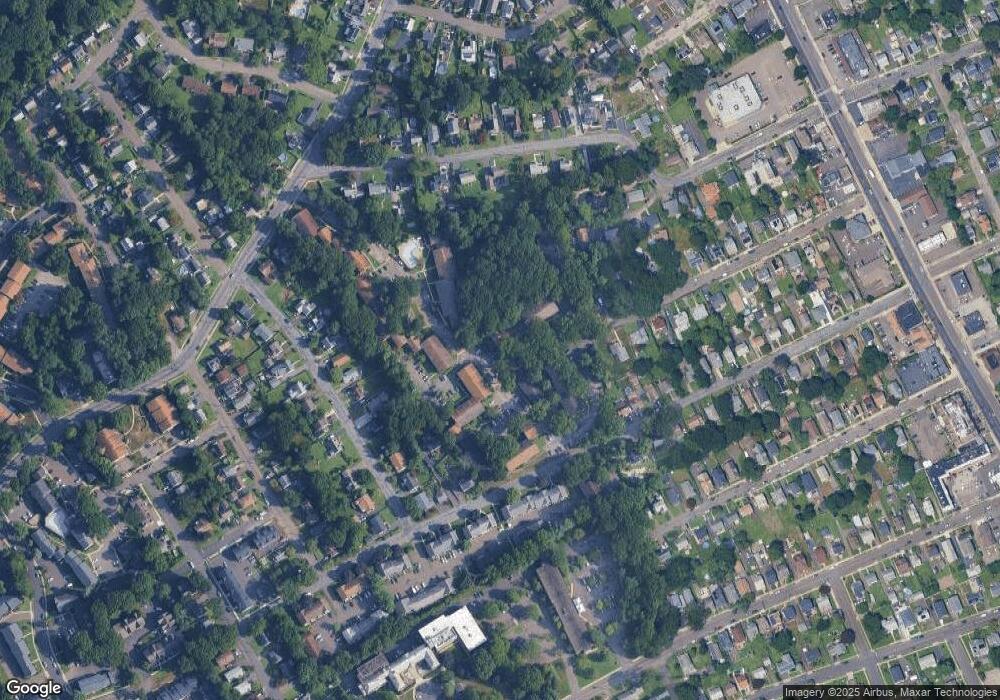
Map
Nearby Homes
- 333 Vincellette St Unit 109
- 288 Sunrise Terrace
- 200 Woodmont Ave Unit 100
- 265 Vincellette St
- 72 Herald Ave
- 490 Woodside Ave
- 245 Glendale Ave Unit D8
- 495 Peet St
- 12 Riverview Dr Unit 12
- 38 Enid St Unit B
- 81 Ameridge Dr
- 339 Goldenrod Ave
- 1095 Wayne St
- 2800 Madison Ave Unit 1B
- 215 Overland Ave
- 50 Greenhouse Rd Unit 65D
- 50 Greenhouse Rd Unit 42C
- 230 Cherry Hill Dr Unit 1A
- 230 Cherry Hill Dr Unit 2B
- 15 Cherry Hill Dr Unit 2A
- 333 Vincellette St Unit 160
- 333 Vincellette St Unit 159
- 333 Vincellette St Unit 158
- 333 Vincellette St Unit 157
- 333 Vincellette St Unit 156
- 333 Vincellette St Unit 155
- 333 Vincellette St Unit 154
- 333 Vincellette St Unit 153
- 333 Vincellette St Unit 152
- 333 Vincellette St Unit 151
- 333 Vincellette St Unit 150
- 333 Vincellette St Unit 149
- 333 Vincellette St Unit 148
- 333 Vincellette St Unit 147
- 333 Vincellette St Unit 146
- 333 Vincellette St Unit 145
- 333 Vincellette St Unit 144
- 333 Vincellette St Unit 143
- 333 Vincellette St Unit 142
- 333 Vincellette St Unit 113