
Seller's Agent in 2021
Richard Westen
RE/MAX Unified Brokers
(309) 837-2273
209 Total Sales
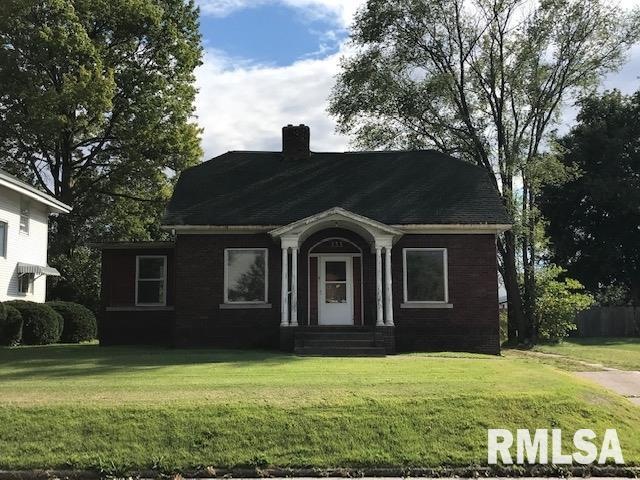
Estimated Value: $40,289 - $72,000
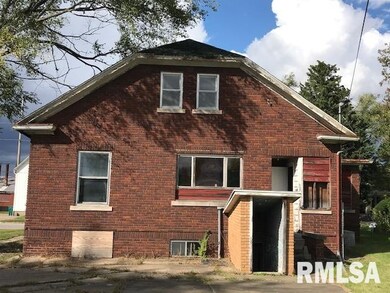
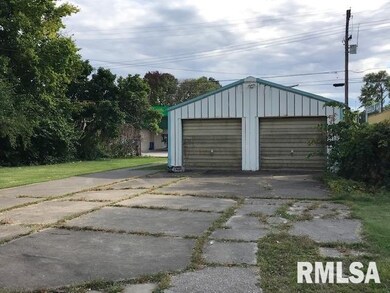
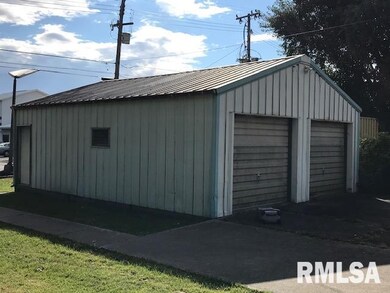
THIS BRICK HOME IS NEARLY GUTTED AND READY FOR EITHER RENOVATION OR TEAR DOWN, THE CHOICE IS YOURS! THE PROPERTY HAS 30 X 24 BUILDING THAT WOULD BE PERFECT TO STORE YOUR MATERIALS AS YOU RENOVATE THE HOUSE. THIS IS A GREAT LOCATION NEAR THE CENTER OF TOWN.
Last Agent to Sell the Property
RE/MAX Unified Brokers License #471019876 Listed on: 09/28/2020
| Date | Buyer | Sale Price | Title Company |
|---|---|---|---|
| Kimble Tiffany | $13,000 | None Available |
| Date | Event | Price | Change | Sq Ft Price |
|---|---|---|---|---|
| 10/12/2021 10/12/21 | Sold | $13,000 | 0.0% | $7 / Sq Ft |
| 09/27/2021 09/27/21 | Pending | -- | -- | -- |
| 12/17/2020 12/17/20 | For Sale | $13,000 | 0.0% | $7 / Sq Ft |
| 12/05/2020 12/05/20 | Pending | -- | -- | -- |
| 09/28/2020 09/28/20 | For Sale | $13,000 | -- | $7 / Sq Ft |
| Year | Tax Paid | Tax Assessment Tax Assessment Total Assessment is a certain percentage of the fair market value that is determined by local assessors to be the total taxable value of land and additions on the property. | Land | Improvement |
|---|---|---|---|---|
| 2024 | $513 | $4,463 | $1,456 | $3,007 |
| 2023 | $526 | $4,277 | $1,395 | $2,882 |
| 2022 | $490 | $4,144 | $1,352 | $2,792 |
| 2021 | $470 | $4,144 | $1,352 | $2,792 |
| 2020 | $557 | $7,969 | $3,006 | $4,963 |
| 2019 | $555 | $5,100 | $3,089 | $2,011 |
| 2018 | $1,668 | $16,009 | $3,089 | $12,920 |
| 2017 | $1,627 | $16,009 | $3,089 | $12,920 |
| 2016 | $1,563 | $15,839 | $3,056 | $12,783 |
| 2015 | $1,538 | $15,477 | $2,986 | $12,491 |
| 2014 | $1,511 | $15,245 | $2,941 | $12,304 |
| 2013 | $1,369 | $15,245 | $2,941 | $12,304 |
Seller's Agent in 2021
Richard Westen
RE/MAX Unified Brokers
(309) 837-2273
209 Total Sales
Buyer's Agent in 2021
Gene Curtis
RE/MAX Unified Brokers
(309) 255-0227
180 Total Sales
Source: RMLS Alliance
MLS Number: PA1219241
APN: 11-100-616-00
Disclaimer: Certain information contained herein is derived from information provided by parties other than Homes.com. All information provided is deemed reliable, but is not guaranteed to be accurate and should be independently verified.
![]() IDX information is provided exclusively for personal, non-commercial use, and may not be used for any purpose other than to identify prospective properties consumers may be interested in purchasing. Information is deemed reliable but not guaranteed.
IDX information is provided exclusively for personal, non-commercial use, and may not be used for any purpose other than to identify prospective properties consumers may be interested in purchasing. Information is deemed reliable but not guaranteed.