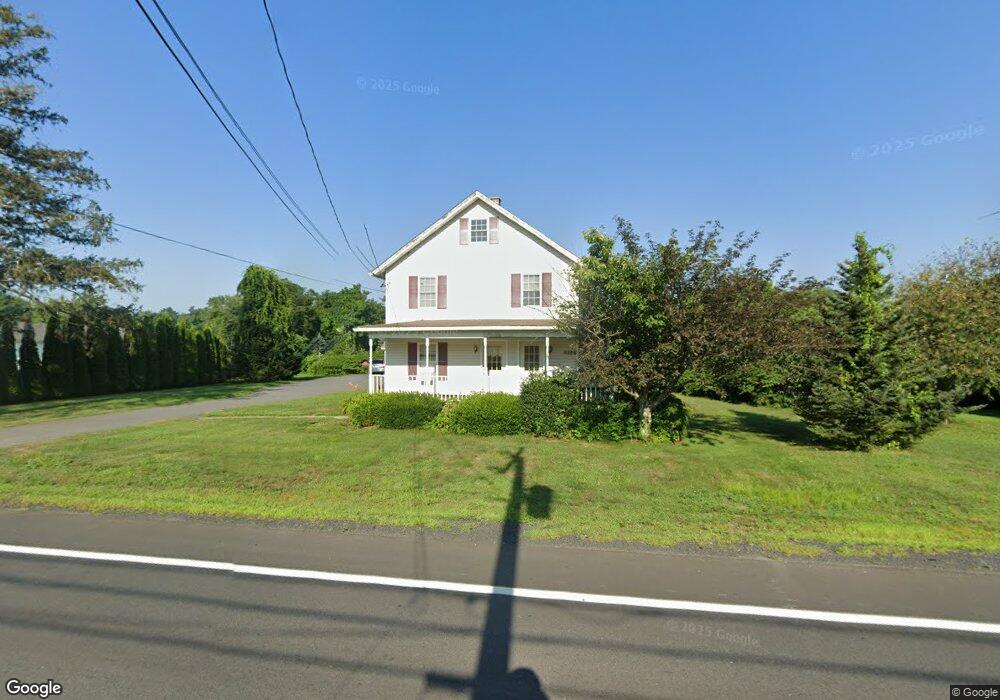
333 West St West Hatfield, MA 01088
Estimated Value: $301,000 - $475,000
12
Beds
2
Baths
2,514
Sq Ft
$164/Sq Ft
Est. Value
About This Home
This home is located at 333 West St, West Hatfield, MA 01088 and is currently estimated at $411,223, approximately $163 per square foot. 333 West St is a home with nearby schools including Hatfield Elementary School and Smith Academy.
Ownership History
Date
Name
Owned For
Owner Type
Purchase Details
Closed on
May 18, 2022
Sold by
Ross James N and Ross Katherine F
Bought by
Ross James N
Current Estimated Value
Purchase Details
Closed on
Mar 23, 2000
Sold by
Johnston Martha I
Bought by
Ross James N and Ross Katherine F
Create a Home Valuation Report for This Property
The Home Valuation Report is an in-depth analysis detailing your home's value as well as a comparison with similar homes in the area
Home Values in the Area
Average Home Value in this Area
Purchase History
| Date | Buyer | Sale Price | Title Company |
|---|---|---|---|
| Ross James N | -- | None Available | |
| Ross James N | -- | None Available | |
| Ross James N | -- | None Available | |
| Ross James N | $75,000 | -- | |
| Ross James N | $75,000 | -- |
Source: Public Records
Mortgage History
| Date | Status | Borrower | Loan Amount |
|---|---|---|---|
| Previous Owner | Ross James N | $20,000 |
Source: Public Records
Tax History
| Year | Tax Paid | Tax Assessment Tax Assessment Total Assessment is a certain percentage of the fair market value that is determined by local assessors to be the total taxable value of land and additions on the property. | Land | Improvement |
|---|---|---|---|---|
| 2025 | $5,558 | $401,600 | $120,900 | $280,700 |
| 2024 | $5,884 | $384,300 | $103,000 | $281,300 |
| 2023 | $4,896 | $363,200 | $98,500 | $264,700 |
| 2022 | $4,507 | $329,700 | $87,300 | $242,400 |
| 2021 | $4,444 | $313,200 | $78,400 | $234,800 |
| 2020 | $4,238 | $313,200 | $78,400 | $234,800 |
| 2019 | $3,773 | $271,600 | $67,200 | $204,400 |
| 2018 | $3,584 | $263,900 | $67,200 | $196,700 |
| 2017 | $3,417 | $258,500 | $67,200 | $191,300 |
| 2016 | $3,382 | $256,600 | $67,200 | $189,400 |
| 2015 | $3,216 | $244,200 | $62,700 | $181,500 |
| 2014 | $3,038 | $239,800 | $58,200 | $181,600 |
Source: Public Records
Map
Nearby Homes
- 151 Pantry Rd
- 0 Pantry Rd Unit 73430264
- 0 Straits Rd
- 7 Christian Ln
- 0 North St Unit 73407299
- 182 Old Stage Rd
- 58 Main St Unit 4
- 58 Main St Unit 3
- 3 Frost Ln
- 18 Elm St
- 12 Dwight St
- 6 Shattuck Rd
- 15 S Plain Rd
- 38 S Plain Rd
- Lot 3 Roosevelt St
- 17 Mountain St Unit B
- 0 Greenfield Rd Unit 73472322
- 0 Greenfield Rd Unit 73467449
- 32 Stonewall Dr
- 15 Crestview Dr
Your Personal Tour Guide
Ask me questions while you tour the home.