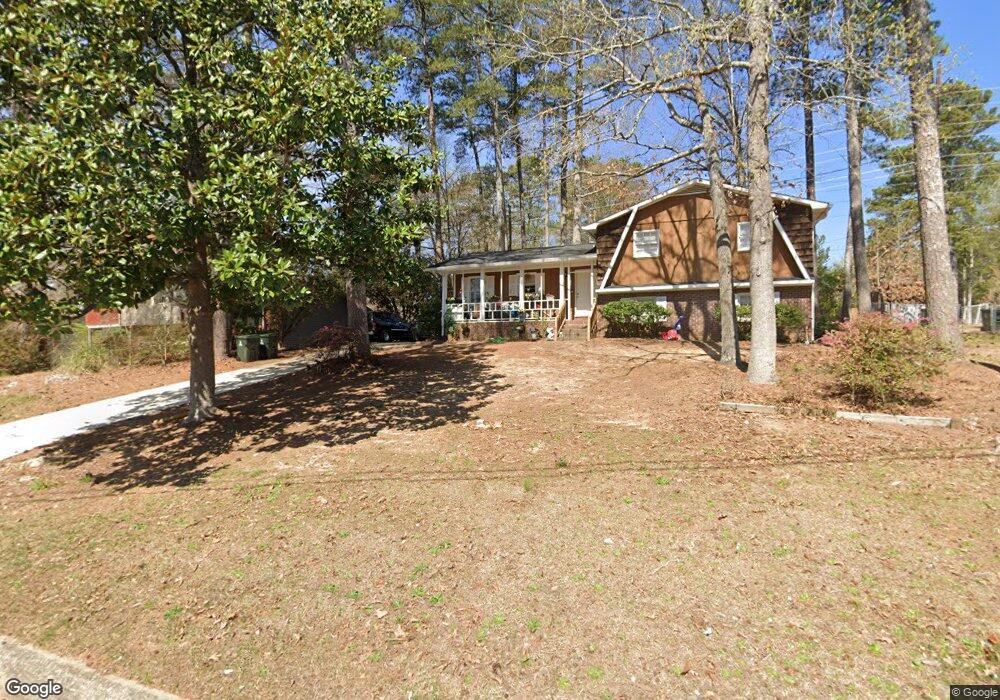
3330 Heatherwood Ln SW Unit 5 Marietta, GA 30008
Southwestern Marietta NeighborhoodEstimated Value: $264,356 - $304,000
3
Beds
2
Baths
1,175
Sq Ft
$243/Sq Ft
Est. Value
About This Home
This home is located at 3330 Heatherwood Ln SW Unit 5, Marietta, GA 30008 and is currently estimated at $285,839, approximately $243 per square foot. 3330 Heatherwood Ln SW Unit 5 is a home located in Cobb County with nearby schools including Hollydale Elementary School, Smitha Middle School, and Osborne High School.
Ownership History
Date
Name
Owned For
Owner Type
Purchase Details
Closed on
Jan 29, 2019
Sold by
Rcm Fund 1 Owner Llc
Bought by
Cerberus Sfr Holdings Ii Lp and C/O First Key Homes Llc
Current Estimated Value
Purchase Details
Closed on
May 1, 2018
Sold by
Brown David
Bought by
Rcm Funding 1 Owner Llc
Purchase Details
Closed on
Feb 28, 1997
Sold by
Getman Robert P Teresa M
Bought by
Brown David Tonya
Create a Home Valuation Report for This Property
The Home Valuation Report is an in-depth analysis detailing your home's value as well as a comparison with similar homes in the area
Home Values in the Area
Average Home Value in this Area
Purchase History
| Date | Buyer | Sale Price | Title Company |
|---|---|---|---|
| Cerberus Sfr Holdings Ii Lp | $330,624 | -- | |
| Rcm Funding 1 Owner Llc | $121,100 | -- | |
| Brown David Tonya | $81,900 | -- |
Source: Public Records
Mortgage History
| Date | Status | Borrower | Loan Amount |
|---|---|---|---|
| Closed | Brown David Tonya | $0 |
Source: Public Records
Tax History Compared to Growth
Tax History
| Year | Tax Paid | Tax Assessment Tax Assessment Total Assessment is a certain percentage of the fair market value that is determined by local assessors to be the total taxable value of land and additions on the property. | Land | Improvement |
|---|---|---|---|---|
| 2025 | $3,062 | $101,624 | $30,000 | $71,624 |
| 2024 | $3,064 | $101,624 | $30,000 | $71,624 |
| 2023 | $2,881 | $95,568 | $20,000 | $75,568 |
| 2022 | $1,970 | $64,908 | $14,000 | $50,908 |
| 2021 | $1,970 | $64,908 | $14,000 | $50,908 |
| 2020 | $1,470 | $48,440 | $12,040 | $36,400 |
| 2019 | $1,470 | $48,440 | $12,040 | $36,400 |
| 2018 | $853 | $38,140 | $11,200 | $26,940 |
| 2017 | $815 | $38,140 | $11,200 | $26,940 |
| 2016 | $691 | $32,920 | $11,200 | $21,720 |
| 2015 | $710 | $32,920 | $11,200 | $21,720 |
| 2014 | $499 | $25,644 | $0 | $0 |
Source: Public Records
Map
Nearby Homes
- 3106 Sasanqua Ln SW
- 2099 Redbud Ct SW
- 3145 Fern Valley Dr SW
- 3000 Fern Valley Dr SW
- 3159 Fern Valley Dr SW
- 3253 Shadowridge Dr SW
- 3112 Patriot Square SW
- 3100 Patriot Square SW
- 1719 Silverchase Dr SW
- 1618 Sparrow Wood Ln SW
- 1613 Sparrow Wood Ln SW Unit 3
- 3055 Milford Chase Overlook SW
- 3269 Perch Dr SW
- 1905 Azure Grove Ct
- 3310 Bryan Way SW
- 1559 Woodmore Dr SW
- 2318 Powder Springs Rd SW
- 3334 Heatherwood Ln SW
- 3334 Heatherwood Ln SW Unit 3334
- 3334 Heatherwood Ln SW
- 3334 Heaterwood Ln SW
- 3326 Heatherwood Ln SW
- 2035 Pair Rd SW
- 3338 Heatherwood Ln SW
- 3333 Heatherwood Ln SW
- 3329 Heatherwood Ln SW
- 3325 Heatherwood Ln SW
- 2039 Pair Rd SW
- 1830 Shadyleaf Ct SW
- 3345 Hollyridge Trail SW
- 3342 Heatherwood Ln SW
- 1829 Shadyleaf Ct SW
- 3147 Boxleaf Dr SW Unit 4
- 2004 Pair Rd SW Unit 2004
- 2004 Pair Rd SW
- 2004 Pair Rd SW Unit 5
- 1991 Pair Rd SW