3330 Merced Place Oxnard, CA 93033
Diamond Bar NeighborhoodEstimated Value: $573,000 - $766,000
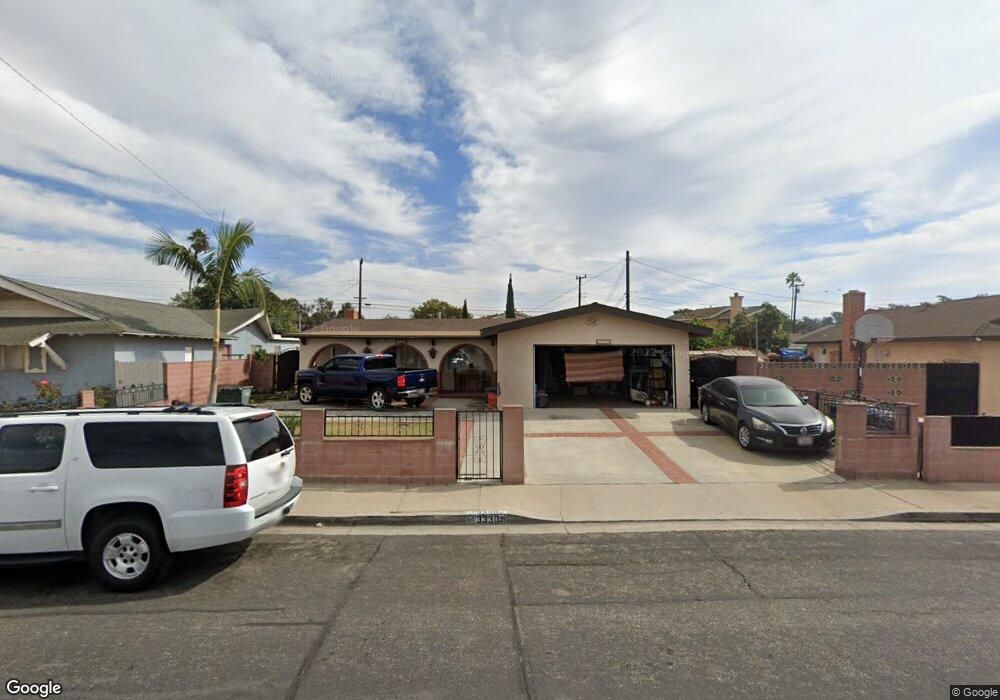
About This Home
This home is located at 3330 Merced Place, Oxnard, CA 93033 and is currently estimated at $701,280, approximately $469 per square foot. 3330 Merced Place is a home located in Ventura County with nearby schools including Channel Islands High School.
Ownership History
We collect this data history from publicly available records. To have your information removed, we recommend requesting removal directly through your county’s website.
Purchase Details
Purchase Details
Purchase Details
Home Financials for this Owner
Home Financials are based on the most recent Mortgage that was taken out on this home.Purchase Details
Home Financials for this Owner
Home Financials are based on the most recent Mortgage that was taken out on this home.Purchase Details
Home Values in the Area
Average Home Value in this Area
Purchase History
We collect this data history from publicly available records. To have your information removed, we recommend requesting removal directly through your county’s website.
| Date | Buyer | Sale Price | Title Company |
|---|---|---|---|
| $242,000 | Landsafe Title San Bernardin | ||
| $276,250 | Landsafe Title | ||
| -- | Multiple | ||
| $635,000 | Multiple | ||
| -- | -- |
Mortgage History
We collect this data history from publicly available records. To have your information removed, we recommend requesting removal directly through your county’s website.
| Date | Status | Borrower | Loan Amount |
|---|---|---|---|
| Previous Owner | $190,500 | ||
| Previous Owner | $444,500 |
Tax History
We collect this data history from publicly available records. To have your information removed, we recommend requesting removal directly through your county’s website.
| Year | Tax Paid | Tax Assessment Tax Assessment Total Assessment is a certain percentage of the fair market value that is determined by local assessors to be the total taxable value of land and additions on the property. | Land | Improvement |
|---|---|---|---|---|
| 2025 | $3,438 | $311,616 | $202,814 | $108,802 |
| 2024 | $3,438 | $305,506 | $198,837 | $106,669 |
| 2023 | $3,494 | $299,516 | $194,938 | $104,578 |
| 2022 | $3,285 | $293,644 | $191,116 | $102,528 |
| 2021 | $3,283 | $287,887 | $187,369 | $100,518 |
| 2020 | $3,375 | $284,938 | $185,449 | $99,489 |
| 2019 | $3,246 | $279,352 | $181,813 | $97,539 |
| 2018 | $3,203 | $273,876 | $178,249 | $95,627 |
| 2017 | $3,120 | $268,506 | $174,754 | $93,752 |
| 2016 | $2,975 | $263,242 | $171,328 | $91,914 |
| 2015 | $3,012 | $259,290 | $168,755 | $90,535 |
| 2014 | $2,945 | $254,212 | $165,450 | $88,762 |
Map
- 3516 Olds Rd
- 1407 Peach Ave Unit 14
- 3700 Olds Rd Unit 38
- 3700 Olds Rd Unit 86
- 2178 Thrush Ave Unit J
- 2167 Cardinal Ave
- 1585 Cherry Ave Unit 100
- 1657 Lime Ave Unit 87
- 2117 Cardinal Ave Unit 2117h
- 2177 Robin Ave Unit 2177A
- 2330 El Dorado Ave Unit D
- 2334 Alexander St
- 2221 Gershwin Place
- 101 Yosemite Dr Unit 142
- 621 La Canada Ave
- 634 E Kamala St
- 2151 E Wooley Rd
- 5000 Halsey Way
- 168 Lark St
- 4160 Petit Dr Unit 39
- 3320 Merced Place
- 3340 Merced Place
- 3430 Modoc Dr
- 3325 Madera Place
- 3335 Madera Place
- 3440 Modoc Dr
- 3310 Merced Place
- 3321 Madera Place
- 3405 Madera Place
- 3331 Merced Place
- 3311 Madera Place
- 3444 Modoc Dr
- 3315 Merced Place
- 3300 Merced Place
- 3410 Modoc Dr
- 3301 Merced Place
- 3301 Madera Place
- 3425 Modoc Dr
- 3230 Merced Place
- 3431 Modoc Dr
Ask me questions while you tour the home.