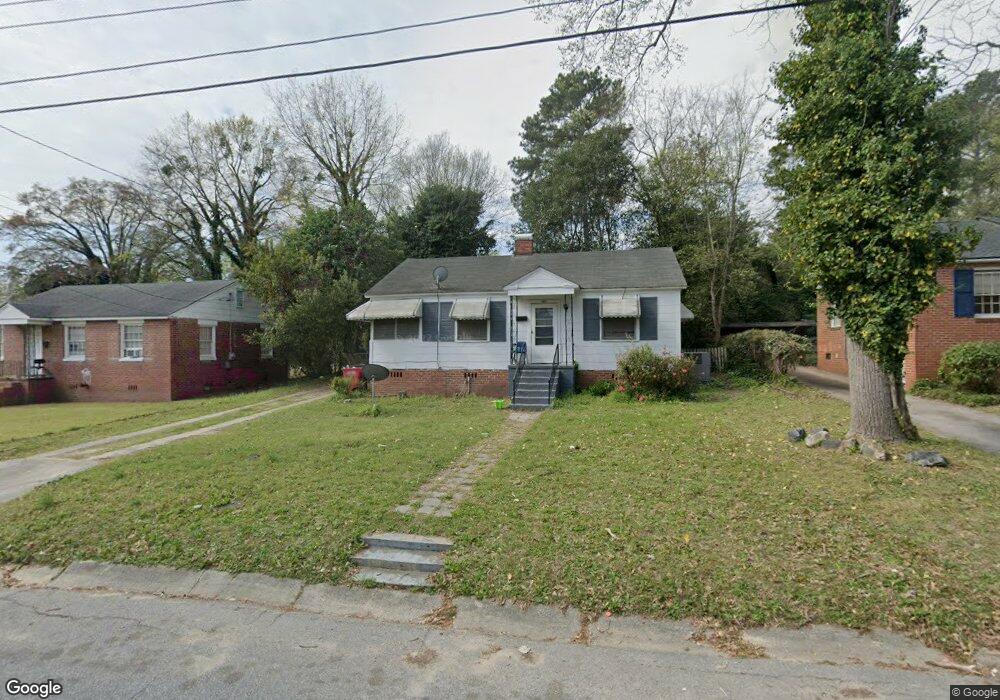
3330 Shaw Dr Macon, GA 31204
Estimated Value: $72,000 - $131,000
3
Beds
2
Baths
1,315
Sq Ft
$73/Sq Ft
Est. Value
About This Home
This home is located at 3330 Shaw Dr, Macon, GA 31204 and is currently estimated at $95,737, approximately $72 per square foot. 3330 Shaw Dr is a home located in Bibb County with nearby schools including Brookdale Elementary School, Howard Middle School, and Howard High School.
Ownership History
Date
Name
Owned For
Owner Type
Purchase Details
Closed on
Apr 4, 2013
Sold by
Dennis Marie A
Bought by
Rumph Derrick
Current Estimated Value
Purchase Details
Closed on
Jul 30, 2008
Sold by
Rumph Derrick
Bought by
Rumph Derrick and Dennis Marie A
Home Financials for this Owner
Home Financials are based on the most recent Mortgage that was taken out on this home.
Original Mortgage
$27,550
Interest Rate
6.37%
Mortgage Type
New Conventional
Purchase Details
Closed on
Mar 6, 2007
Purchase Details
Closed on
May 31, 2000
Create a Home Valuation Report for This Property
The Home Valuation Report is an in-depth analysis detailing your home's value as well as a comparison with similar homes in the area
Home Values in the Area
Average Home Value in this Area
Purchase History
| Date | Buyer | Sale Price | Title Company |
|---|---|---|---|
| Rumph Derrick | -- | None Available | |
| Rumph Derrick | -- | None Available | |
| Rumph Derrick L | -- | None Available | |
| -- | $46,700 | -- | |
| Hud | $46,709 | None Available | |
| Wells Fargo Bank Na | $46,709 | None Available | |
| -- | $54,800 | -- |
Source: Public Records
Mortgage History
| Date | Status | Borrower | Loan Amount |
|---|---|---|---|
| Previous Owner | Rumph Derrick | $27,550 |
Source: Public Records
Tax History Compared to Growth
Tax History
| Year | Tax Paid | Tax Assessment Tax Assessment Total Assessment is a certain percentage of the fair market value that is determined by local assessors to be the total taxable value of land and additions on the property. | Land | Improvement |
|---|---|---|---|---|
| 2025 | $56 | $2,280 | $2,280 | $0 |
| 2024 | $677 | $26,646 | $2,280 | $24,366 |
| 2023 | $677 | $26,646 | $2,280 | $24,366 |
| 2022 | $575 | $16,599 | $1,220 | $15,379 |
| 2021 | $496 | $13,058 | $1,037 | $12,021 |
| 2020 | $507 | $13,058 | $1,037 | $12,021 |
| 2019 | $511 | $13,058 | $1,037 | $12,021 |
| 2018 | $963 | $13,058 | $1,037 | $12,021 |
| 2017 | $489 | $13,058 | $1,037 | $12,021 |
| 2016 | $452 | $13,058 | $1,037 | $12,021 |
| 2015 | $639 | $13,058 | $1,037 | $12,021 |
| 2014 | $966 | $17,148 | $2,075 | $15,074 |
Source: Public Records
Map
Nearby Homes