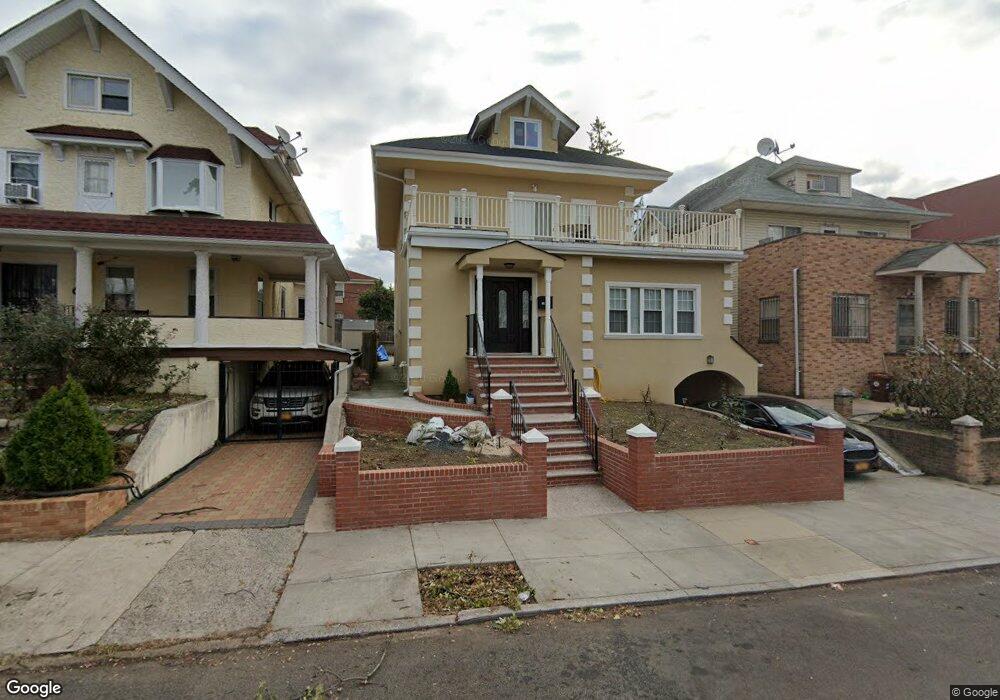
3331 153rd St Flushing, NY 11354
Murray Hill-Broadway NeighborhoodEstimated Value: $1,147,000 - $1,584,000
Studio
--
Bath
2,252
Sq Ft
$603/Sq Ft
Est. Value
About This Home
This home is located at 3331 153rd St, Flushing, NY 11354 and is currently estimated at $1,356,901, approximately $602 per square foot. 3331 153rd St is a home located in Queens County with nearby schools including P.S. 21 Edward Hart, Jhs 185 Edward Bleeker, and Flushing High School.
Ownership History
Date
Name
Owned For
Owner Type
Purchase Details
Closed on
Nov 23, 2015
Sold by
Emiroglu Sermin
Bought by
Liulu Tang Ying
Current Estimated Value
Purchase Details
Closed on
Jan 30, 2006
Sold by
Jun Youn Hee and Yilmaz Mehmet
Bought by
Emiroglu Sermim
Purchase Details
Closed on
Jan 6, 2004
Sold by
Triple J Enterprises Llc
Bought by
Jun Youn Hee and Yilmaz Mehmet
Home Financials for this Owner
Home Financials are based on the most recent Mortgage that was taken out on this home.
Original Mortgage
$561,600
Interest Rate
5.71%
Mortgage Type
Purchase Money Mortgage
Purchase Details
Closed on
Nov 27, 2001
Sold by
Vitulli-Wolosin Jacquel and Vitulli-Nassauer Joan
Bought by
Triple J Enterprises Ll
Purchase Details
Closed on
Jul 18, 2000
Sold by
Vitulli Joseph D and Vitulli Joseph
Bought by
Vitulli Wolosin Jacqueline and Vitulli Nassauer Joan
Create a Home Valuation Report for This Property
The Home Valuation Report is an in-depth analysis detailing your home's value as well as a comparison with similar homes in the area
Home Values in the Area
Average Home Value in this Area
Purchase History
| Date | Buyer | Sale Price | Title Company |
|---|---|---|---|
| Liulu Tang Ying | $595,200 | -- | |
| Liulu Tang Ying | $595,200 | -- | |
| Liulu Tang Ying | $595,200 | -- | |
| Liulu Tang Ying | $595,200 | -- | |
| Liulu Tang Ying | $595,200 | -- | |
| Liulu Tang Ying | $595,200 | -- | |
| Emiroglu Sermim | $925,600 | -- | |
| Emiroglu Sermim | $925,600 | -- | |
| Emiroglu Sermim | $925,600 | -- | |
| Emiroglu Sermim | $925,600 | -- | |
| Jun Youn Hee | $624,000 | -- | |
| Jun Youn Hee | $624,000 | -- | |
| Jun Youn Hee | $624,000 | -- | |
| Jun Youn Hee | $624,000 | -- | |
| Triple J Enterprises Ll | -- | -- | |
| Triple J Enterprises Ll | -- | -- | |
| Triple J Enterprises Ll | -- | -- | |
| Triple J Enterprises Ll | -- | -- | |
| Vitulli Wolosin Jacqueline | -- | First American Title Ins Co | |
| Vitulli Wolosin Jacqueline | -- | First American Title Ins Co | |
| Vitulli Wolosin Jacqueline | -- | First American Title Ins Co | |
| Vitulli Wolosin Jacqueline | -- | First American Title Ins Co |
Source: Public Records
Mortgage History
| Date | Status | Borrower | Loan Amount |
|---|---|---|---|
| Previous Owner | Jun Youn Hee | $561,600 |
Source: Public Records
Tax History
| Year | Tax Paid | Tax Assessment Tax Assessment Total Assessment is a certain percentage of the fair market value that is determined by local assessors to be the total taxable value of land and additions on the property. | Land | Improvement |
|---|---|---|---|---|
| 2025 | $8,688 | $45,848 | $10,385 | $35,463 |
| 2024 | $8,688 | $43,254 | $11,195 | $32,059 |
| 2023 | $8,196 | $40,807 | $8,954 | $31,853 |
| 2022 | $8,146 | $78,840 | $19,380 | $59,460 |
| 2021 | $8,523 | $72,000 | $19,380 | $52,620 |
| 2020 | $8,087 | $70,380 | $19,380 | $51,000 |
| 2019 | $7,540 | $67,860 | $19,380 | $48,480 |
| 2018 | $6,932 | $34,006 | $9,878 | $24,128 |
| 2017 | $6,932 | $34,006 | $12,669 | $21,337 |
| 2016 | $6,747 | $34,006 | $12,669 | $21,337 |
| 2015 | $3,869 | $31,839 | $13,123 | $18,716 |
| 2014 | $3,869 | $30,038 | $14,853 | $15,185 |
Source: Public Records
Map
Nearby Homes
- 3307 153rd St
- 33-38 153rd St
- 151-08 33rd Rd
- 153-06 32nd Ave
- 33-19 155th St
- 32-20 156th St
- 32-15 Murray Ln
- 33-35 150th Place
- 32-24 157th St
- 3425 150th Place Unit 6E
- 34-25 150th Place Unit 3E
- 30-27 Murray Ln
- 3226 158th St
- 35-35 155th St
- 149-43 35 Ave Unit 3J
- 35-10 150th St Unit 6A
- 15002 Northern Blvd Unit 4B
- 15002 Northern Blvd Unit 6G
- 15002 Northern Blvd Unit 5H
- 150-02 Northern Blvd Unit 5F
- 33-31 153rd St Unit 2
- 33-31 153rd St Unit 3
- 3331 153rd St
- 3331 153rd St Unit 2
- 3331 153rd St Unit 3
- 3327 153rd St
- 3335 153rd St
- 33-27 153rd St
- 3323 153rd St
- 3339 153rd St
- 3326 154th St
- 3334 154th St
- 3319 153rd St
- 3343 153rd St
- 3338 154th St
- 33-28 153rd St
- 3322 154th St
- 33-22 154th St
- 3338 154th St
- 3340 154th St
Your Personal Tour Guide
Ask me questions while you tour the home.