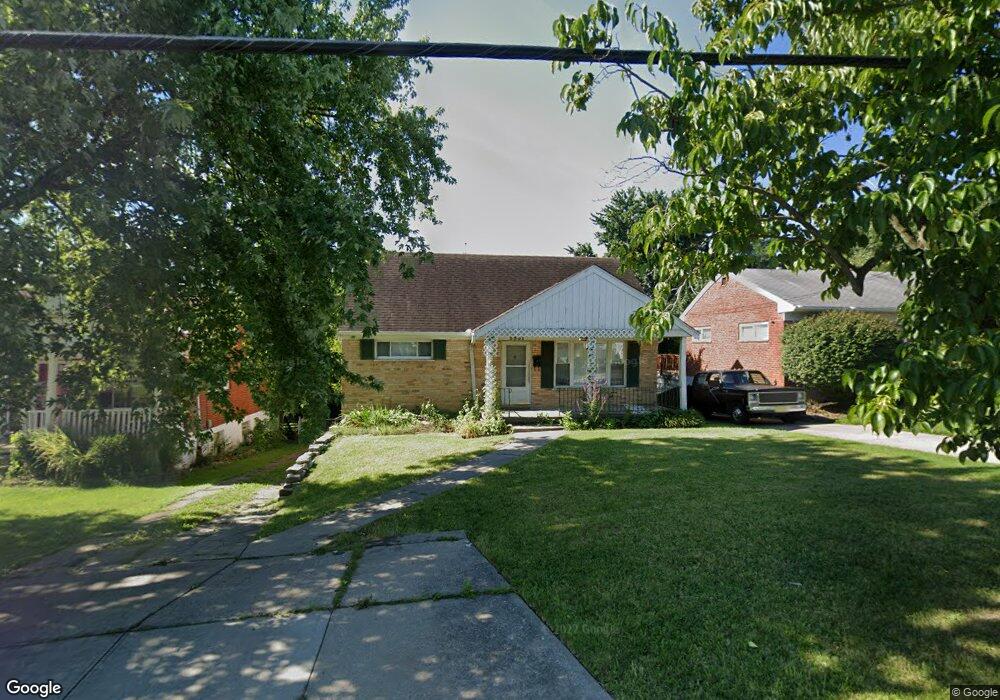
3331 Robinet Dr Cincinnati, OH 45238
Westwood NeighborhoodEstimated Value: $124,000 - $204,626
4
Beds
2
Baths
1,946
Sq Ft
$93/Sq Ft
Est. Value
About This Home
This home is located at 3331 Robinet Dr, Cincinnati, OH 45238 and is currently estimated at $181,157, approximately $93 per square foot. 3331 Robinet Dr is a home located in Hamilton County with nearby schools including Midway Elementary School, Western Hills High School, and Gilbert A. Dater High School.
Ownership History
Date
Name
Owned For
Owner Type
Purchase Details
Closed on
Sep 23, 2009
Sold by
Deutsche Bank National Trust Company
Bought by
Miken Enterprises Llc
Current Estimated Value
Purchase Details
Closed on
Aug 4, 2009
Sold by
Berry Bobbie
Bought by
Deutsche Bank National Trust Company
Purchase Details
Closed on
Sep 27, 2002
Sold by
Stauss Benjamin S and Stauss Sandra L
Bought by
Berry Bobbie
Home Financials for this Owner
Home Financials are based on the most recent Mortgage that was taken out on this home.
Original Mortgage
$112,133
Interest Rate
6.34%
Mortgage Type
Unknown
Purchase Details
Closed on
Jul 29, 1994
Sold by
Turner Tom G and Turner Patricia A
Bought by
Stauss Benjamin S and Kirchner Sandra L
Home Financials for this Owner
Home Financials are based on the most recent Mortgage that was taken out on this home.
Original Mortgage
$74,575
Interest Rate
8.53%
Create a Home Valuation Report for This Property
The Home Valuation Report is an in-depth analysis detailing your home's value as well as a comparison with similar homes in the area
Home Values in the Area
Average Home Value in this Area
Purchase History
| Date | Buyer | Sale Price | Title Company |
|---|---|---|---|
| Miken Enterprises Llc | $50,100 | Resource Title Agency Of Cin | |
| Deutsche Bank National Trust Company | $60,000 | None Available | |
| Berry Bobbie | $113,100 | -- | |
| Stauss Benjamin S | -- | -- |
Source: Public Records
Mortgage History
| Date | Status | Borrower | Loan Amount |
|---|---|---|---|
| Previous Owner | Berry Bobbie | $112,133 | |
| Previous Owner | Stauss Benjamin S | $74,575 |
Source: Public Records
Tax History
| Year | Tax Paid | Tax Assessment Tax Assessment Total Assessment is a certain percentage of the fair market value that is determined by local assessors to be the total taxable value of land and additions on the property. | Land | Improvement |
|---|---|---|---|---|
| 2025 | $3,166 | $49,791 | $7,203 | $42,588 |
| 2024 | $3,162 | $49,791 | $7,203 | $42,588 |
| 2023 | $3,167 | $49,791 | $7,203 | $42,588 |
| 2022 | $1,853 | $26,121 | $5,849 | $20,272 |
| 2021 | $1,818 | $26,121 | $5,849 | $20,272 |
| 2020 | $1,813 | $26,121 | $5,849 | $20,272 |
| 2019 | $1,821 | $23,745 | $5,317 | $18,428 |
| 2018 | $1,823 | $23,745 | $5,317 | $18,428 |
| 2017 | $1,755 | $23,745 | $5,317 | $18,428 |
| 2016 | $1,278 | $16,832 | $6,174 | $10,658 |
| 2015 | $1,143 | $16,832 | $6,174 | $10,658 |
| 2014 | $1,149 | $16,832 | $6,174 | $10,658 |
| 2013 | $1,216 | $17,535 | $6,433 | $11,102 |
Source: Public Records
Map
Nearby Homes
- 2195 Woodmere Ct
- 3004 Glenmore Ave
- 5487 Belcross Ct
- 5461 Bellfield Ln
- 3141 W Tower Ave
- 5524 Sidney Rd
- 3305 Queen City Ave
- 3124 Veazey Ave
- 3531 Werk Rd
- 2710 Carroll Ave
- 3281 Pickbury Dr
- 5301 Leon Ct
- 2925 Boudinot Ave
- 1650 Colonial Dr
- 3061 Veazey Ave
- 3230 Stanhope Ave
- 2985 Welge Ln
- 3106 Werk Rd
- 3238 Buell St
- 2713 Falconbridge Dr
- 3335 Robinet Dr
- 3325 Robinet Dr
- 3339 Robinet Dr
- 3321 Robinet Dr
- 3343 Robinet Dr
- 3317 Robinet Dr
- 3328 Robinet Dr
- 3332 Robinet Dr
- 3324 Robinet Dr
- 3347 Robinet Dr
- 3336 Robinet Dr
- 3320 Robinet Dr
- 3340 Robinet Dr
- 3351 Robinet Dr
- 3316 Robinet Dr
- 3316 Robinet Dr Unit 3316 Robinet Dr
- 2591 Anderson Ferry Rd
- 2595 Anderson Ferry Rd
- 2587 Anderson Ferry Rd
- 2553 Anderson Ferry Rd
Your Personal Tour Guide
Ask me questions while you tour the home.