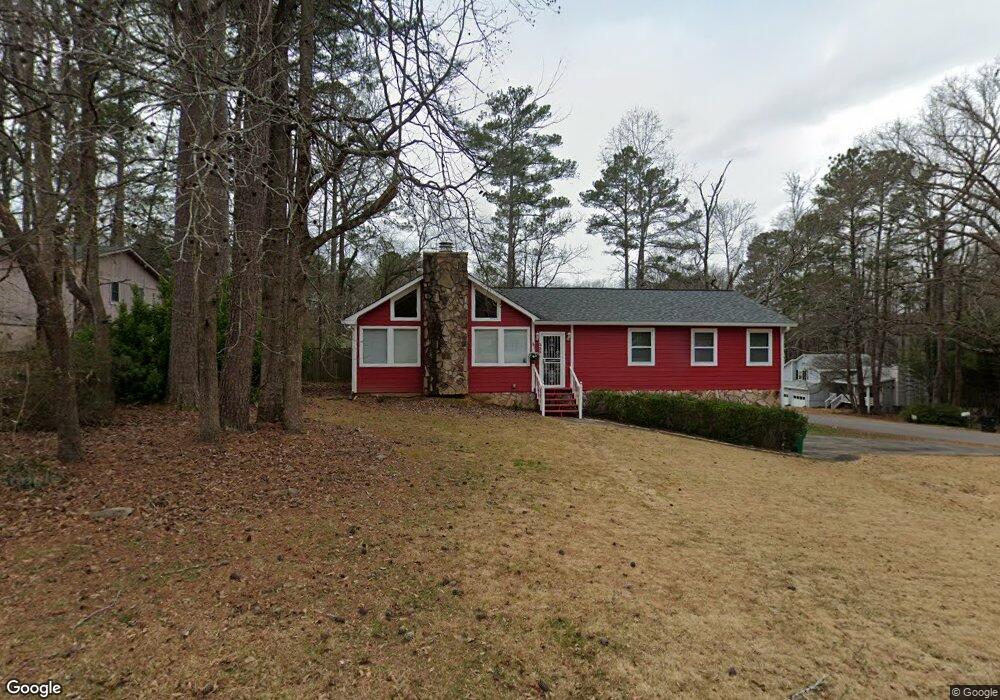
3332 King Arthur Dr SW Marietta, GA 30008
Southwestern Marietta NeighborhoodEstimated Value: $296,000 - $345,000
3
Beds
3
Baths
1,365
Sq Ft
$230/Sq Ft
Est. Value
About This Home
This home is located at 3332 King Arthur Dr SW, Marietta, GA 30008 and is currently estimated at $314,365, approximately $230 per square foot. 3332 King Arthur Dr SW is a home located in Cobb County with nearby schools including Deerwood Elementary School, Russell Elementary School, and Floyd Middle School.
Ownership History
Date
Name
Owned For
Owner Type
Purchase Details
Closed on
Nov 23, 2010
Sold by
Federal Natl Mtg Assn Fnma
Bought by
White Tracy D
Current Estimated Value
Purchase Details
Closed on
Sep 7, 2010
Sold by
Citimortgage
Bought by
Federal Natl Mtg Assn Fnma
Purchase Details
Closed on
Apr 26, 2004
Sold by
Carroll Jackson Realty Co
Bought by
Marquez Maria A
Home Financials for this Owner
Home Financials are based on the most recent Mortgage that was taken out on this home.
Original Mortgage
$140,900
Interest Rate
5.36%
Mortgage Type
New Conventional
Purchase Details
Closed on
Feb 3, 2004
Sold by
Heckmann Michael F and Heckmann Rosemary
Bought by
Carroll Jackson Realty Co
Create a Home Valuation Report for This Property
The Home Valuation Report is an in-depth analysis detailing your home's value as well as a comparison with similar homes in the area
Home Values in the Area
Average Home Value in this Area
Purchase History
| Date | Buyer | Sale Price | Title Company |
|---|---|---|---|
| White Tracy D | $57,000 | -- | |
| Federal Natl Mtg Assn Fnma | -- | -- | |
| Citimortgage | $113,833 | -- | |
| Marquez Maria A | $140,900 | -- | |
| Carroll Jackson Realty Co | $10,000 | -- |
Source: Public Records
Mortgage History
| Date | Status | Borrower | Loan Amount |
|---|---|---|---|
| Previous Owner | Marquez Maria A | $140,900 |
Source: Public Records
Tax History Compared to Growth
Tax History
| Year | Tax Paid | Tax Assessment Tax Assessment Total Assessment is a certain percentage of the fair market value that is determined by local assessors to be the total taxable value of land and additions on the property. | Land | Improvement |
|---|---|---|---|---|
| 2025 | $3,804 | $126,252 | $22,000 | $104,252 |
| 2024 | $3,806 | $126,252 | $22,000 | $104,252 |
| 2023 | $3,275 | $108,620 | $22,000 | $86,620 |
| 2022 | $2,399 | $79,048 | $14,000 | $65,048 |
| 2021 | $2,399 | $79,048 | $14,000 | $65,048 |
| 2020 | $2,076 | $68,408 | $14,000 | $54,408 |
| 2019 | $1,748 | $57,584 | $8,000 | $49,584 |
| 2018 | $1,748 | $57,584 | $8,000 | $49,584 |
| 2017 | $1,630 | $56,712 | $10,000 | $46,712 |
| 2016 | $1,072 | $37,272 | $10,000 | $27,272 |
| 2015 | $953 | $32,348 | $10,000 | $22,348 |
| 2014 | $670 | $22,544 | $0 | $0 |
Source: Public Records
Map
Nearby Homes
- 3340 Vineland Dr SW
- 1559 Woodmore Dr SW
- 1613 Sparrow Wood Ln SW Unit 3
- 1618 Sparrow Wood Ln SW
- 1810 Killarney Dr SW
- 3517 Greenway Dr SW
- 1719 Silverchase Dr SW
- 1539 Rockingway Dr SW
- 3408 Double Eagle Dr Unit 28
- 1702 Merry Oak Rd SW
- 3383 Raes Creek Rd Unit 4
- 3309 Raes Creek Rd Unit 13
- 1570 Halbrook Place SW
- Reynolds Plan at Hampton Trace
- Forsyth Plan at Hampton Trace
- 1427 Lost Bridge Rd
- 3123 Milford Chase SW
- 1905 Azure Grove Ct
- 3559 Ashley Station Dr SW
- 3340 King Arthur Dr SW
- 1612 Sir Galahad Dr SW
- 3331 Sir Lancelot Place SW
- 3333 King Arthur Dr SW
- 1620 Sir Galahad Dr SW
- 3335 Sir Lancelot Place SW
- 3348 King Arthur Dr SW
- 3348 King Arthur Dr SW Unit 3
- 3341 King Arthur Dr SW
- 1628 Sir Galahad Dr SW
- 1604 Sir Galahad Dr SW
- 1536 Corbin Place SW
- 3339 Sir Lancelot Place SW
- 0 Sir Galahad Dr SW Unit 7504109
- 0 Sir Galahad Dr SW Unit 3222509
- 0 Sir Galahad Dr SW Unit 8395245
- 0 Sir Galahad Dr SW Unit 8030372
- 0 Sir Galahad Dr SW Unit 8431190
- 1636 Sir Galahad Dr SW
- 3356 King Arthur Dr SW