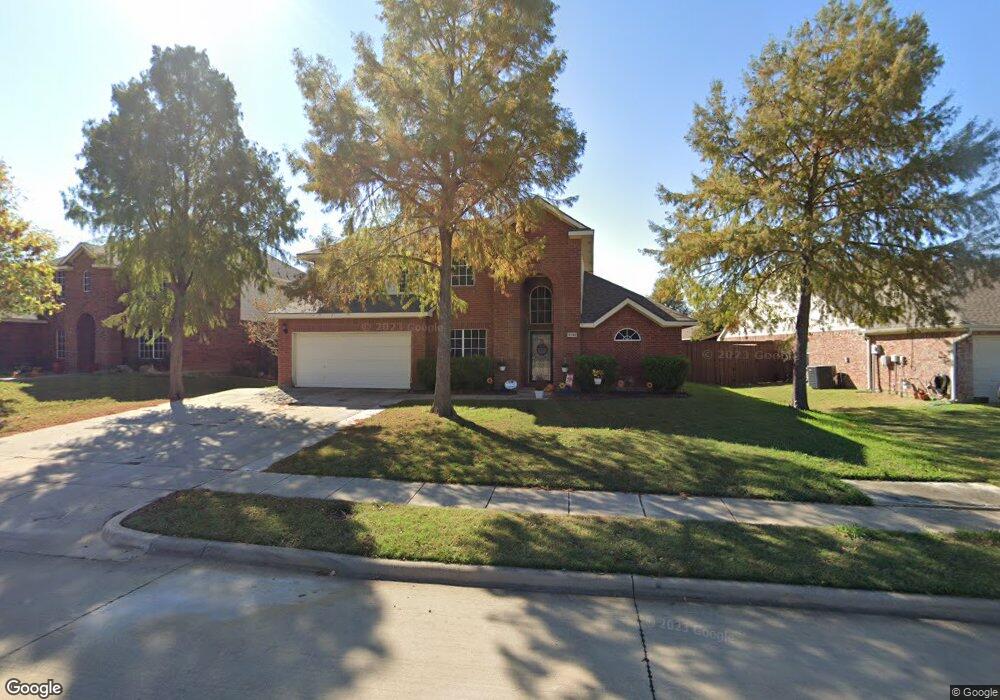
3332 Mustang Dr Denton, TX 76210
South Denton NeighborhoodEstimated Value: $433,205 - $454,000
4
Beds
3
Baths
2,466
Sq Ft
$180/Sq Ft
Est. Value
About This Home
This home is located at 3332 Mustang Dr, Denton, TX 76210 and is currently estimated at $443,551, approximately $179 per square foot. 3332 Mustang Dr is a home located in Denton County with nearby schools including Houston Elementary School, McMath Middle School, and Denton High School.
Ownership History
Date
Name
Owned For
Owner Type
Purchase Details
Closed on
Dec 4, 2020
Sold by
Crain Ronny Lynn and Crain Kimberly
Bought by
Dinsmore Jon Eric and Dinsmore Shanna
Current Estimated Value
Home Financials for this Owner
Home Financials are based on the most recent Mortgage that was taken out on this home.
Original Mortgage
$277,400
Outstanding Balance
$246,283
Interest Rate
2.8%
Mortgage Type
New Conventional
Estimated Equity
$197,268
Purchase Details
Closed on
Mar 22, 2012
Sold by
Crain Laurie Espinoza
Bought by
Crain Ronny Lynn
Home Financials for this Owner
Home Financials are based on the most recent Mortgage that was taken out on this home.
Original Mortgage
$131,492
Interest Rate
3.97%
Mortgage Type
Credit Line Revolving
Purchase Details
Closed on
Feb 24, 2003
Sold by
Bowen Builders Group Of Texas Inc
Bought by
Crain Ronny L and Crain Laurie E
Home Financials for this Owner
Home Financials are based on the most recent Mortgage that was taken out on this home.
Original Mortgage
$154,989
Interest Rate
5.86%
Mortgage Type
VA
Create a Home Valuation Report for This Property
The Home Valuation Report is an in-depth analysis detailing your home's value as well as a comparison with similar homes in the area
Home Values in the Area
Average Home Value in this Area
Purchase History
| Date | Buyer | Sale Price | Title Company |
|---|---|---|---|
| Dinsmore Jon Eric | -- | Atd | |
| Crain Ronny Lynn | -- | None Available | |
| Crain Ronny L | -- | -- | |
| Crain Ronny L | -- | -- |
Source: Public Records
Mortgage History
| Date | Status | Borrower | Loan Amount |
|---|---|---|---|
| Open | Dinsmore Jon Eric | $277,400 | |
| Previous Owner | Crain Ronny Lynn | $131,492 | |
| Previous Owner | Crain Ronny L | $154,989 |
Source: Public Records
Tax History Compared to Growth
Tax History
| Year | Tax Paid | Tax Assessment Tax Assessment Total Assessment is a certain percentage of the fair market value that is determined by local assessors to be the total taxable value of land and additions on the property. | Land | Improvement |
|---|---|---|---|---|
| 2025 | $7,402 | $450,759 | $94,663 | $356,096 |
| 2024 | $8,597 | $445,413 | $94,663 | $350,750 |
| 2023 | $8,070 | $422,643 | $94,663 | $327,980 |
| 2022 | $8,680 | $408,873 | $94,663 | $314,210 |
| 2021 | $6,892 | $310,017 | $70,136 | $239,881 |
| 2020 | $6,358 | $278,179 | $70,136 | $211,828 |
| 2019 | $6,034 | $252,890 | $70,136 | $203,809 |
| 2018 | $5,554 | $229,900 | $70,136 | $200,250 |
| 2017 | $0 | $209,000 | $41,434 | $204,110 |
| 2016 | $4,696 | $190,000 | $41,434 | $148,566 |
| 2014 | -- | $165,000 | $41,434 | $123,566 |
| 2013 | -- | $165,000 | $41,434 | $123,566 |
Source: Public Records
Map
Nearby Homes
- 3432 Sundown Blvd
- 2209 Loon Lake Rd
- 2505 Pioneer Dr
- 2508 Pioneer Dr
- 2409 Loon Lake Rd
- 2312 Caddo Cir
- 2600 Pioneer Dr
- 2000 Lamprey Cir
- 2601 Pinto Dr
- 2009 Lake Fork Ct
- 2713 Clubhouse Dr
- 2617 Hereford Rd
- 2721 Arabian Ave
- 2617 Hollow Ridge Dr
- 2008 Moonsail Ln
- 2501 Great Bear Ln
- 720 Smokerise Cir
- 1108 Ellison Park Cir
- 2817 Hereford Rd
- 2804 Hollow Ridge Dr
- 3400 Mustang Dr
- 3328 Mustang Dr
- 3404 Mustang Dr
- 3324 Mustang Dr
- 3425 Sundown Blvd
- 3429 Sundown Blvd
- 3421 Sundown Blvd
- 3408 Mustang Dr
- 3433 Sundown Blvd
- 3320 Mustang Dr
- 3417 Sundown Blvd
- 2201 Palamino Ct
- 3329 Mustang Dr
- 3412 Mustang Dr
- 3316 Mustang Dr
- 2205 Palamino Ct
- 3413 Sundown Blvd
- 3325 Mustang Dr
- 2300 Palamino Ct
- 2301 Ranch House Dr