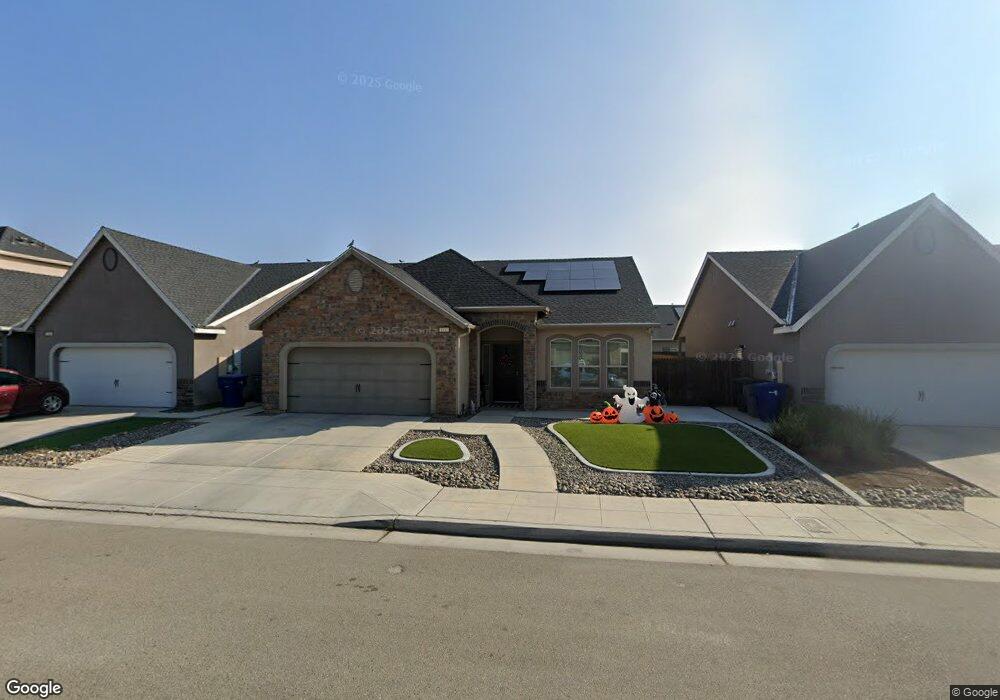
3332 N Shelly Ave Fresno, CA 93727
McLane NeighborhoodEstimated Value: $458,487 - $617,000
3
Beds
2
Baths
1,899
Sq Ft
$270/Sq Ft
Est. Value
About This Home
This home is located at 3332 N Shelly Ave, Fresno, CA 93727 and is currently estimated at $513,622, approximately $270 per square foot. 3332 N Shelly Ave is a home with nearby schools including Tomahawk School, Roger S. Oraze Elementary School, and E. J. Marshall Elementary.
Ownership History
Date
Name
Owned For
Owner Type
Purchase Details
Closed on
Nov 18, 2019
Sold by
Montoya Rachel May
Bought by
Montoya Richard A
Current Estimated Value
Home Financials for this Owner
Home Financials are based on the most recent Mortgage that was taken out on this home.
Original Mortgage
$298,162
Outstanding Balance
$262,567
Interest Rate
3.65%
Estimated Equity
$251,055
Purchase Details
Closed on
Nov 12, 2019
Sold by
Montoya Richard A
Bought by
Montoya Richard A
Home Financials for this Owner
Home Financials are based on the most recent Mortgage that was taken out on this home.
Original Mortgage
$298,162
Outstanding Balance
$262,567
Interest Rate
3.65%
Estimated Equity
$251,055
Purchase Details
Closed on
Jun 1, 2017
Sold by
Lennar Homes Of California Inc
Bought by
Montoya Richard A
Home Financials for this Owner
Home Financials are based on the most recent Mortgage that was taken out on this home.
Original Mortgage
$303,140
Interest Rate
4.05%
Mortgage Type
VA
Create a Home Valuation Report for This Property
The Home Valuation Report is an in-depth analysis detailing your home's value as well as a comparison with similar homes in the area
Home Values in the Area
Average Home Value in this Area
Purchase History
| Date | Buyer | Sale Price | Title Company |
|---|---|---|---|
| Montoya Richard A | -- | Chicago Title Company | |
| Montoya Richard A | -- | Chicago Title Company | |
| Montoya Richard A | $303,500 | North American Title Concord |
Source: Public Records
Mortgage History
| Date | Status | Borrower | Loan Amount |
|---|---|---|---|
| Open | Montoya Richard A | $298,162 | |
| Previous Owner | Montoya Richard A | $303,140 |
Source: Public Records
Tax History Compared to Growth
Tax History
| Year | Tax Paid | Tax Assessment Tax Assessment Total Assessment is a certain percentage of the fair market value that is determined by local assessors to be the total taxable value of land and additions on the property. | Land | Improvement |
|---|---|---|---|---|
| 2025 | $4,639 | $351,767 | $98,647 | $253,120 |
| 2024 | $4,598 | $344,870 | $96,713 | $248,157 |
| 2023 | $4,598 | $338,109 | $94,817 | $243,292 |
| 2022 | $4,347 | $331,480 | $92,958 | $238,522 |
| 2021 | $3,954 | $324,982 | $91,136 | $233,846 |
| 2020 | $3,939 | $321,651 | $90,202 | $231,449 |
| 2019 | $3,862 | $315,345 | $88,434 | $226,911 |
| 2018 | $4,022 | $309,162 | $86,700 | $222,462 |
| 2017 | $451 | $16,309 | $16,309 | $0 |
| 2016 | $26 | $990 | $990 | $0 |
Source: Public Records
Map
Nearby Homes
- 3342 N Carriage Ave
- 3329 N Shelly Ave
- 3062 N Filbert Ave
- 6406 E Giavanna Ave
- 6157 E Garland Ave
- 6165 E Farrin Ave
- 2788 N Douglas Ave
- 7128 E Simpson Ave
- 6083 E Andrews Ave
- 3278 Magnolia Ave
- 2870 N Sophie Dr
- 2756 N Douglas Ave
- 7269 E Cortland Ave
- 2871 N Cypress Ave
- 2833 N Armstrong Ave
- 2648 N Armstrong Ave
- 7369 E Garland Ave
- 2819 N Redda Rd
- 2735 N Redda Rd
- 3083 N Stanley Ave
- 3346 N Shelly Ave
- 3318 N Shelly Ave
- 3360 N Shelly Ave Unit 71
- 3360 N Shelly Ave
- 3341 N Pearwood Ave
- 3313 N Pearwood Ave
- 3355 N Pearwood Ave
- 3315 N Shelly Ave
- 3374 N Shelly Ave
- 3343 N Shelly Ave
- 3357 N Shelly Ave
- 6589 E Redlands Ave
- 3369 N Pearwood Ave
- 6577 E Redlands Ave
- 6601 E Redlands Ave
- 6565 E Redlands Ave Unit 54
- 6565 E Redlands Ave
- 3371 N Shelly Ave Unit 63
- 6613 E Redlands Ave Unit 50
- 6613 E Redlands Ave