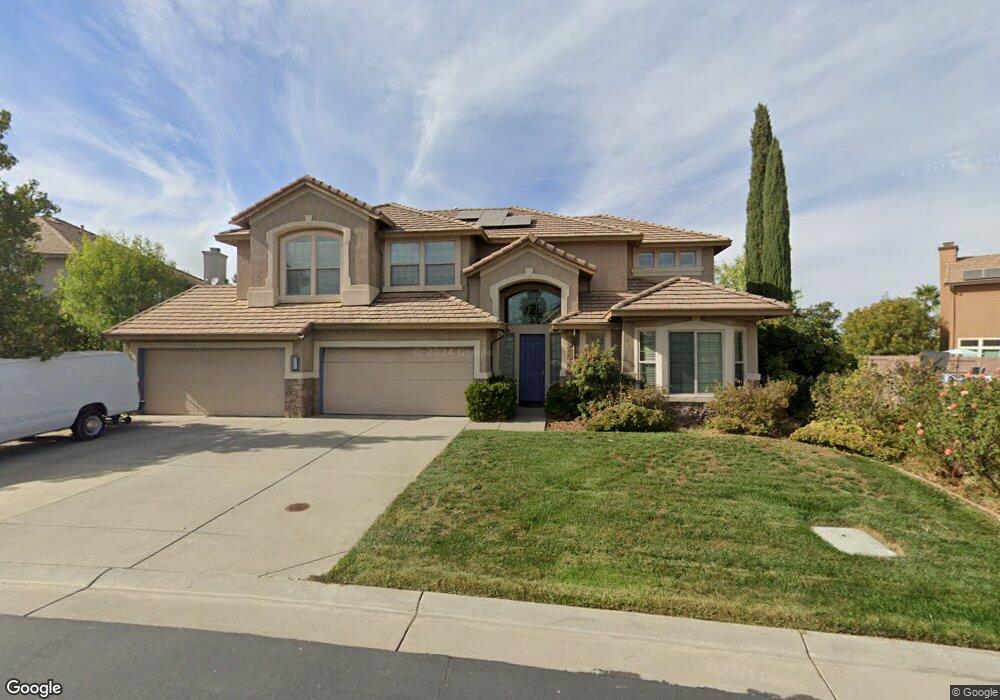
33326 Redhead Ct Woodland, CA 95695
Estimated Value: $434,000 - $892,532
5
Beds
3
Baths
4,121
Sq Ft
$186/Sq Ft
Est. Value
About This Home
This home is located at 33326 Redhead Ct, Woodland, CA 95695 and is currently estimated at $767,133, approximately $186 per square foot. 33326 Redhead Ct is a home located in Yolo County with nearby schools including Esparto K-8, Esparto Middle, and Esparto High School.
Ownership History
Date
Name
Owned For
Owner Type
Purchase Details
Closed on
Sep 27, 2023
Sold by
Ryley Anthony
Bought by
Anthony Ryley Revocable Living Trust and Ryley
Current Estimated Value
Purchase Details
Closed on
Dec 10, 2022
Sold by
Ryley Anthony
Bought by
Anthony Ryley Trust and Ryley
Purchase Details
Closed on
Mar 7, 2011
Sold by
Lane Harris Rickaye and Lane Larue Richard
Bought by
Ryley Anthony
Home Financials for this Owner
Home Financials are based on the most recent Mortgage that was taken out on this home.
Original Mortgage
$310,000
Interest Rate
4.75%
Mortgage Type
Purchase Money Mortgage
Purchase Details
Closed on
Jan 11, 2005
Sold by
Jts Communities Inc
Bought by
Larue Richard Lane and Harris Rickaye
Home Financials for this Owner
Home Financials are based on the most recent Mortgage that was taken out on this home.
Original Mortgage
$559,083
Interest Rate
5.8%
Mortgage Type
Stand Alone First
Create a Home Valuation Report for This Property
The Home Valuation Report is an in-depth analysis detailing your home's value as well as a comparison with similar homes in the area
Home Values in the Area
Average Home Value in this Area
Purchase History
| Date | Buyer | Sale Price | Title Company |
|---|---|---|---|
| Anthony Ryley Revocable Living Trust | -- | None Listed On Document | |
| Anthony Ryley Trust | -- | None Listed On Document | |
| Ryley Anthony | $410,000 | Fidelity Natl Title Co Of Ca | |
| Larue Richard Lane | $699,000 | First American Title |
Source: Public Records
Mortgage History
| Date | Status | Borrower | Loan Amount |
|---|---|---|---|
| Previous Owner | Ryley Anthony | $310,000 | |
| Previous Owner | Larue Richard Lane | $559,083 |
Source: Public Records
Tax History Compared to Growth
Tax History
| Year | Tax Paid | Tax Assessment Tax Assessment Total Assessment is a certain percentage of the fair market value that is determined by local assessors to be the total taxable value of land and additions on the property. | Land | Improvement |
|---|---|---|---|---|
| 2025 | $11,972 | $525,271 | $153,735 | $371,536 |
| 2023 | $11,972 | $504,875 | $147,766 | $357,109 |
| 2022 | $11,544 | $494,976 | $144,869 | $350,107 |
| 2021 | $11,436 | $485,272 | $142,029 | $343,243 |
| 2020 | $11,196 | $480,297 | $140,573 | $339,724 |
| 2019 | $10,882 | $470,880 | $137,817 | $333,063 |
| 2018 | $10,713 | $461,648 | $135,115 | $326,533 |
| 2017 | $8,963 | $452,597 | $132,466 | $320,131 |
| 2016 | $8,955 | $443,723 | $129,869 | $313,854 |
| 2015 | $8,982 | $437,059 | $127,919 | $309,140 |
| 2014 | $8,982 | $428,499 | $125,414 | $303,085 |
Source: Public Records
Map
Nearby Homes
- 18306 Gadwall St
- 18040 Ruddy St
- 18043 Wood Duck St
- 33426 Canvas Back St
- 33887 Mallard St
- 33565 Wildwing Dr
- 34000 Canvas Back St
- 34070 Canvas Back St
- 33033 State Highway 16
- 34761 Mallard St
- 34676 Canvas Back St
- 18400 Mandarin St
- 33033 California 16
- 19858 Hillcrest Dr
- 30435 S Co Rd 25 Rd
- 164 W Beamer
- 38067 County Road 17
- 34186 County Road 25
- 35655 County Road 20
- 36334 California 16
- 33320 Redhead Ct
- 18246 Gadwall St
- 18242 Gadwall St
- 18252 Gadwall St
- 33314 Redhead Ct
- 33319 Redhead Ct
- 33317 Redhead Ct
- 18222 Gadwall St
- 18249 Gadwall St
- 18257 Gadwall St
- 18237 Gadwall St
- 18210 Gadwall St
- 18231 Gadwall St
- 33324 Merganser Ct
- 18268 Gadwall St
- 18265 Gadwall St
- 18215 Gadwall St
- 18202 Gadwall St
- 18271 Gadwall St
- 18207 Gadwall St