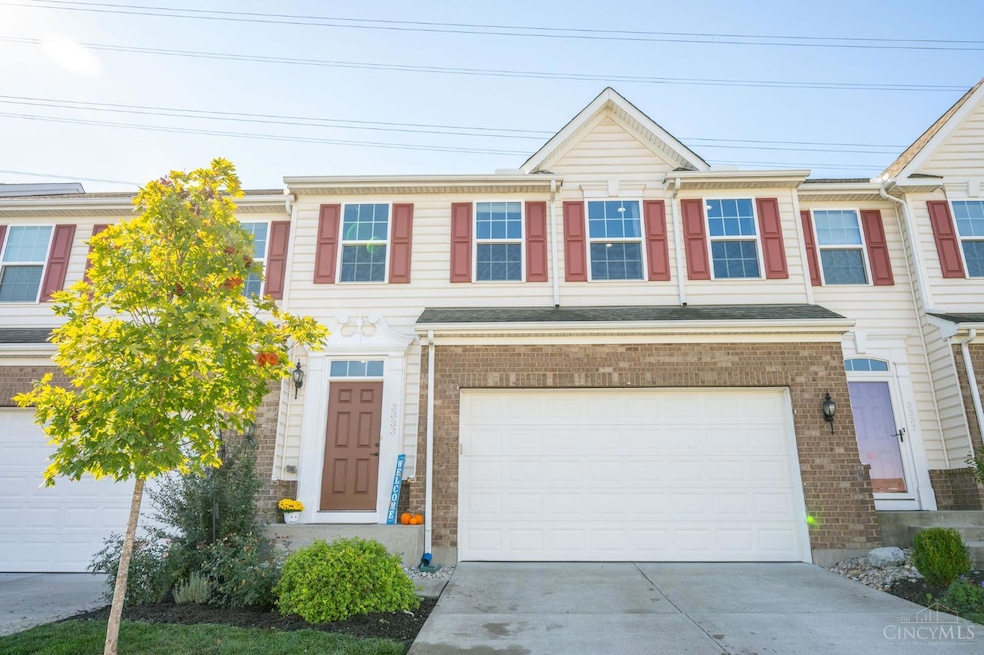
3333 Crescent Falls Way Maineville, OH 45039
Landen NeighborhoodEstimated payment $2,878/month
Highlights
- Transitional Architecture
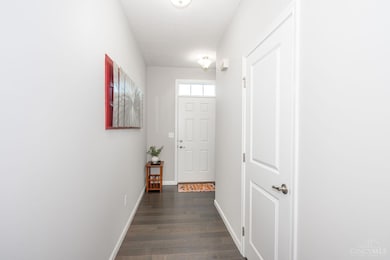
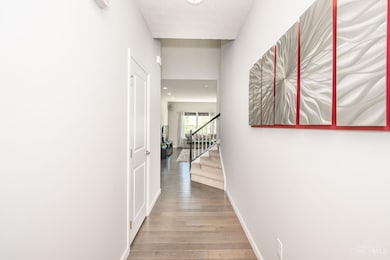
- Wood Flooring
- Bathtub
- Kings Junior High School Rated A-
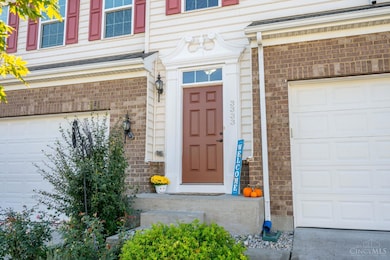
- Porch
- Walk-In Closet
About This Home
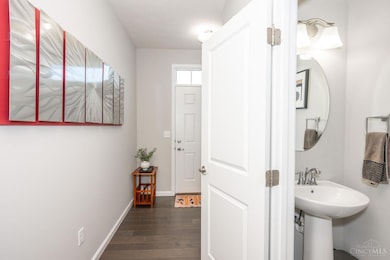
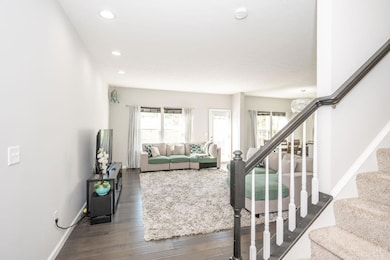
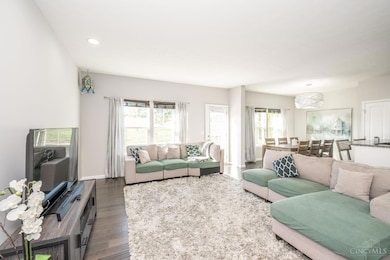
Never shovel snow or cut grass again spend your time at the community pool instead! All included in the HOA. This Ryan Home resale is loaded with upgrades and located in the heart of Maineville. Impressive grand entry opens to a light-filled dining, living, and gourmet kitchen area featuring a large island, granite counters, 42 cabinetry, and updated stainless steel appliances. Tall ceilings create a spacious feel throughout. The primary suite offers a jetted tub, double sinks, and walk-in closet. Enjoy fresh paint, new carpet, and wide-plank engineered hardwood on the main level. One of only two homes in the community with a double-sized private patio perfect for relaxing or entertaining. The finished basement adds even more living space with a full bath and theatre room. Move-in ready and low-maintenance living at its best!
Townhouse Details
Home Type
- Townhome
Est. Annual Taxes
- $6,328
Year Built
- Built in 2016
Lot Details
- Private Entrance
HOA Fees
- $175 Monthly HOA Fees
Parking
- 2 Car Garage
- Front Facing Garage
- Garage Door Opener
- Driveway
- Off-Street Parking
Home Design
- Transitional Architecture
- Traditional Architecture
- Entry on the 1st floor
- Brick Exterior Construction
- Poured Concrete
- Shingle Roof
- Vinyl Siding
Interior Spaces
- 2,325 Sq Ft Home
- Property has 3 Levels
- Ceiling height of 9 feet or more
- Ceiling Fan
- Recessed Lighting
- Chandelier
- Vinyl Clad Windows
- Insulated Windows
- Double Hung Windows
- Panel Doors
Kitchen
- Breakfast Bar
- Oven or Range
- Microwave
- Dishwasher
- Disposal
Flooring
- Wood
- Tile
Bedrooms and Bathrooms
- 3 Bedrooms
- Walk-In Closet
- Dual Vanity Sinks in Primary Bathroom
- Bathtub
Laundry
- Laundry in unit
- Dryer
- Washer
Finished Basement
- Basement Fills Entire Space Under The House
- Sump Pump
Home Security
Outdoor Features
- Patio
- Porch
Utilities
- Forced Air Heating and Cooling System
- Heating System Uses Gas
- Gas Water Heater
- Cable TV Available
Community Details
Overview
- Association fees include clubhouse, exercise facility, landscapingcommunity, maintenance exterior, play area, pool, professional mgt, snow removal, tennis, trash
- Stonegate Property Association
- Falls Of Landen Subdivision
Security
- Fire and Smoke Detector
Map
Home Values in the Area
Average Home Value in this Area
Tax History
| Year | Tax Paid | Tax Assessment Tax Assessment Total Assessment is a certain percentage of the fair market value that is determined by local assessors to be the total taxable value of land and additions on the property. | Land | Improvement |
|---|---|---|---|---|
| 2024 | $6,328 | $122,550 | $18,380 | $104,170 |
| 2023 | $5,421 | $94,318 | $13,258 | $81,060 |
| 2022 | $5,335 | $94,318 | $13,258 | $81,060 |
| 2021 | $4,463 | $94,318 | $13,258 | $81,060 |
| 2020 | $4,312 | $76,682 | $10,780 | $65,902 |
| 2019 | $4,370 | $76,682 | $10,780 | $65,902 |
| 2018 | $4,382 | $76,682 | $10,780 | $65,902 |
| 2017 | $4,482 | $69,976 | $10,007 | $59,969 |
| 2016 | $540 | $8,008 | $8,008 | $0 |
| 2015 | -- | $0 | $0 | $0 |
Property History
| Date | Event | Price | List to Sale | Price per Sq Ft |
|---|---|---|---|---|
| 11/10/2025 11/10/25 | Under Contract | -- | -- | -- |
| 11/03/2025 11/03/25 | For Rent | $2,600 | 0.0% | -- |
| 10/31/2025 10/31/25 | Price Changed | $415,000 | -2.4% | $178 / Sq Ft |
| 10/15/2025 10/15/25 | For Sale | $425,000 | -- | $183 / Sq Ft |
Purchase History
| Date | Type | Sale Price | Title Company |
|---|---|---|---|
| Survivorship Deed | $255,500 | Cincinnatus Title | |
| Warranty Deed | -- | None Available | |
| Warranty Deed | $195,000 | Attorney | |
| Deed | -- | -- |
Mortgage History
| Date | Status | Loan Amount | Loan Type |
|---|---|---|---|
| Open | $204,400 | New Conventional | |
| Previous Owner | -- | No Value Available |
Source: MLS of Greater Cincinnati (CincyMLS)
MLS Number: 1856317
APN: 16-22-405-019
Disclaimer: Certain information contained herein is derived from information provided by parties other than Homes.com. All information provided is deemed reliable, but is not guaranteed to be accurate and should be independently verified.
![]() The data relating to real estate for sale on this website comes in part from the Broker Reciprocity programs of the MLS of Greater Cincinnati, Inc.. Those listings held by brokerage firms other than Ten-X are marked with the Broker Reciprocity logo and house icon. The properties displayed may not be all of the properties available through Broker Reciprocity.
The data relating to real estate for sale on this website comes in part from the Broker Reciprocity programs of the MLS of Greater Cincinnati, Inc.. Those listings held by brokerage firms other than Ten-X are marked with the Broker Reciprocity logo and house icon. The properties displayed may not be all of the properties available through Broker Reciprocity.
IDX information is provided exclusively for personal, non-commercial use, and may not be used for any purpose other than to identify prospective properties consumers may be interested in purchasing.
Information is deemed reliable but not guaranteed.
Ten-X does not display the entire Cincinnati MLS Broker Reciprocity™ database on this web site. The listings of some real estate brokerage firms have been excluded.
Copyright 2025, MLS of Greater Cincinnati, Inc. All rights reserved
- 3432 Hidden Falls Ct
- 3110 Grand Falls Blvd
- 3244 Grand Falls Blvd Unit 33I
- 3216 Grand Falls Blvd Unit B33
- 3224 Grand Falls Blvd Unit D
- 7629 Watercrest Ct
- 7496 Victoria Falls Ave
- 7411 Victoria Falls Ave
- 7826 Columbia Rd
- 7826 Deerhurst Place
- 2885 Chaise Ln
- 3444 Cutter Ln
- 2834 Afton Valley Ct
- 7609 Mansion Cir
- 8126 Baywood Ct
- 7881 Hackney Cir
- 7860 Hackney Cir
- 2675 Carriagegate Ln
- 7854 Deer Crossing Dr
- 8309 Marigold Ln
- 7629 Watercrest Ct
- 2675 Carriagegate Ln
- 4233 N Haven Dr
- 8390 Old Orchard Ln
- 4023 Fieldsedge Dr
- 6671 Foxfield Dr
- 440 David Ln
- 3501 Montgomery Rd
- 8502 Sugar Maple Dr
- 3580 Steeplechase Ln
- 447 Lockhaven Ct
- 447 Lockhaven Ct Unit 447 Lockhaven Ct
- 443 Lockhaven Ct
- 7402 Twin Fountains Dr
- 112 Elmlinger Dr
- 5550 Club Park Dr
- 204 Sherwood Green Ct
- 9980 Hanover Way
- 6389 Willow Ln
- 8685 Woolstone Ct
