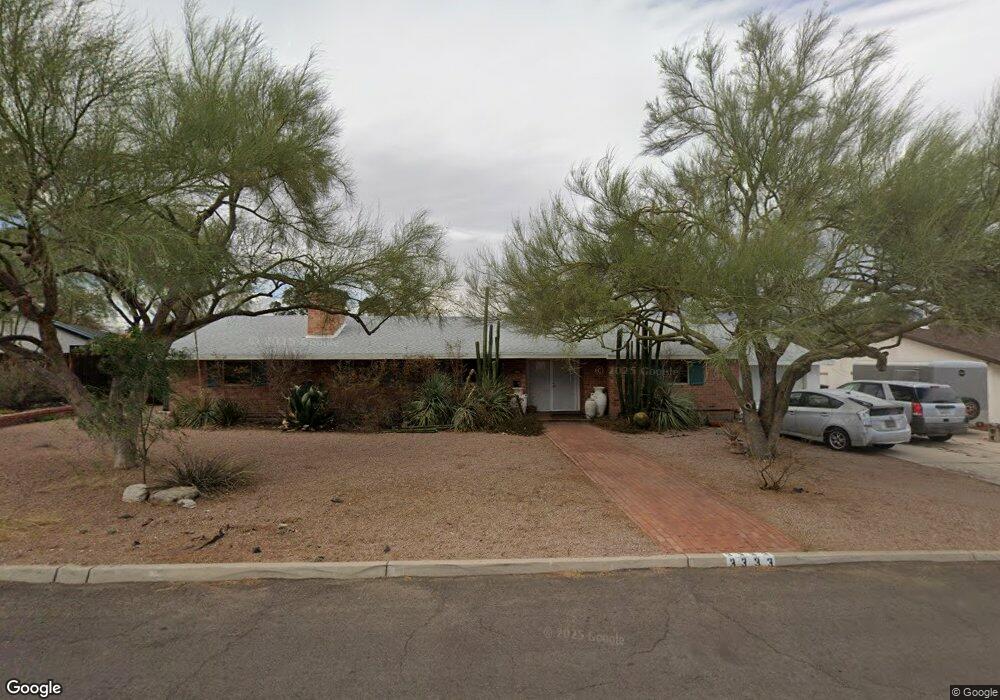
3333 E 4th St Tucson, AZ 85716
Miramonte NeighborhoodEstimated Value: $525,542 - $721,000
3
Beds
2
Baths
2,292
Sq Ft
$274/Sq Ft
Est. Value
About This Home
This home is located at 3333 E 4th St, Tucson, AZ 85716 and is currently estimated at $628,386, approximately $274 per square foot. 3333 E 4th St is a home located in Pima County with nearby schools including Sam Hughes Elementary, Mansfeld Middle School, and Tucson High Magnet School.
Ownership History
Date
Name
Owned For
Owner Type
Purchase Details
Closed on
Nov 26, 2012
Sold by
Platte Steven M
Bought by
Shuman Jessica Lee
Current Estimated Value
Purchase Details
Closed on
May 13, 2008
Sold by
Cannata Kevin J and Martin Maureen A
Bought by
Platte Steven M
Purchase Details
Closed on
Aug 1, 2000
Sold by
Seely Jonathan F and Seely Edith
Bought by
Cannata Kevin J and Martin Maureen A
Purchase Details
Closed on
May 12, 1998
Sold by
Seely Jonathan F and Seely Edith
Bought by
Seely Jonathan F and Seely Edith
Purchase Details
Closed on
Dec 14, 1994
Sold by
Sakrison James M
Bought by
Seely Jonathan F and Seely Edith
Home Financials for this Owner
Home Financials are based on the most recent Mortgage that was taken out on this home.
Original Mortgage
$95,000
Interest Rate
9.1%
Mortgage Type
Seller Take Back
Purchase Details
Closed on
Nov 10, 1989
Sold by
Sakrison John M and Sakrison Mari E
Bought by
Sakrison John M
Create a Home Valuation Report for This Property
The Home Valuation Report is an in-depth analysis detailing your home's value as well as a comparison with similar homes in the area
Home Values in the Area
Average Home Value in this Area
Purchase History
| Date | Buyer | Sale Price | Title Company |
|---|---|---|---|
| Shuman Jessica Lee | -- | None Available | |
| Shuman Jessica Lee | -- | None Available | |
| Platte Steven M | $435,000 | Ttise | |
| Cannata Kevin J | $218,250 | -- | |
| Seely Jonathan F | -- | -- | |
| Seely Jonathan F | $165,000 | -- | |
| Sakrison John M | -- | -- |
Source: Public Records
Mortgage History
| Date | Status | Borrower | Loan Amount |
|---|---|---|---|
| Previous Owner | Seely Jonathan F | $95,000 |
Source: Public Records
Tax History
| Year | Tax Paid | Tax Assessment Tax Assessment Total Assessment is a certain percentage of the fair market value that is determined by local assessors to be the total taxable value of land and additions on the property. | Land | Improvement |
|---|---|---|---|---|
| 2026 | $3,885 | $34,963 | -- | -- |
| 2025 | $3,885 | $33,298 | -- | -- |
| 2024 | $3,487 | $31,712 | -- | -- |
| 2023 | $3,487 | $30,202 | $0 | $0 |
| 2022 | $3,513 | $28,764 | $0 | $0 |
| 2021 | $3,526 | $26,090 | $0 | $0 |
| 2020 | $3,384 | $26,090 | $0 | $0 |
| 2019 | $3,287 | $29,242 | $0 | $0 |
| 2018 | $3,135 | $22,537 | $0 | $0 |
| 2017 | $2,992 | $22,537 | $0 | $0 |
| 2016 | $2,917 | $21,464 | $0 | $0 |
| 2015 | $2,790 | $20,442 | $0 | $0 |
Source: Public Records
Map
Nearby Homes
- 3310 E 4th St
- 3236 E 2nd St
- 3511 E 4th St Unit 2
- 3137 E Terra Alta Blvd
- 3255 E 2nd St
- 745 N Richey Blvd
- 3605 E 3rd St
- 3021 E 2nd St
- 521 N Country Club Rd Unit 67
- 3304 E Bellevue St
- 922 N Chrysler Dr Unit 1
- 3022 E 6th St
- 3022 E 6th St Unit L47
- 3457 E Cody St
- 3018 E 6th St Unit B30
- 40 E Plaza Del Encanto
- 3685 E Baker Place
- 3008 E 6th St Unit 15
- 341 N Joesler Ct
- 814 N Dodge Blvd
- 3341 E 4th St
- 3321 E 4th St
- 3326 E Edgemont St
- 3334 E Edgemont St
- 3318 E Edgemont St
- 725 N Camino Miramonte
- 3336 E 4th St
- 701 N Camino Miramonte
- 3311 E 4th St
- 3320 E 4th St
- 3310 E Edgemont St
- 3348 E 4th St
- 805 N Camino Miramonte
- 3325 E Edgemont St
- 3317 E Edgemont St
- 3360 E 4th St
- 3325 E Terra Alta Blvd
- 3404 E Edgemont St
- 3337 E Terra Alta Blvd
- 3309 E Edgemont St
Your Personal Tour Guide
Ask me questions while you tour the home.