3333 Illinois Ave Rowley, IA 52329
Estimated Value: $256,235 - $341,000
3
Beds
1
Bath
1,216
Sq Ft
$240/Sq Ft
Est. Value
About This Home
This home is located at 3333 Illinois Ave, Rowley, IA 52329 and is currently estimated at $291,745, approximately $239 per square foot. 3333 Illinois Ave is a home located in Buchanan County with nearby schools including West Elementary School, East Elementary School, and Independence Junior/Senior High School.
Create a Home Valuation Report for This Property
The Home Valuation Report is an in-depth analysis detailing your home's value as well as a comparison with similar homes in the area
Home Values in the Area
Average Home Value in this Area
Tax History Compared to Growth
Tax History
| Year | Tax Paid | Tax Assessment Tax Assessment Total Assessment is a certain percentage of the fair market value that is determined by local assessors to be the total taxable value of land and additions on the property. | Land | Improvement |
|---|---|---|---|---|
| 2025 | $1,184 | $219,000 | $19,380 | $199,620 |
| 2024 | $1,184 | $77,210 | $15,730 | $61,480 |
| 2023 | $1,146 | $77,210 | $15,730 | $61,480 |
| 2022 | $1,174 | $71,080 | $12,260 | $58,820 |
| 2021 | $1,124 | $71,080 | $12,260 | $58,820 |
| 2020 | $1,124 | $64,980 | $10,930 | $54,050 |
| 2019 | $1,132 | $61,640 | $10,930 | $50,710 |
| 2018 | $1,060 | $71,630 | $15,490 | $56,140 |
| 2017 | $1,236 | $71,630 | $15,490 | $56,140 |
| 2016 | $1,208 | $85,522 | $17,050 | $68,472 |
| 2015 | $1,208 | $85,522 | $17,050 | $68,472 |
| 2014 | $1,332 | $93,266 | $21,950 | $71,316 |
Source: Public Records
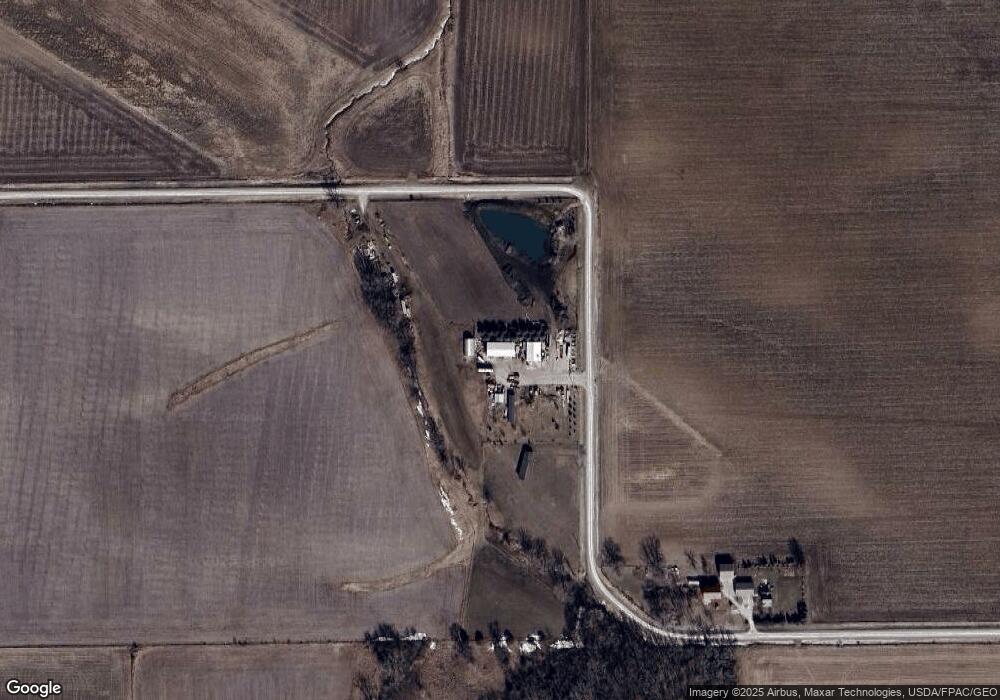
Map
Nearby Homes
- 2831 52nd St
- 0 51st St Ln Unit 2508608
- 705 South St
- 0 25th Ave
- 0 31st Ave
- 3054 Lucas Ave
- lot 9 Future Phase 4 Urbana Towne Center
- Lot 10 Future Phase Urbana Towne Center
- 150 Towne Centre Dr
- 1114 Towne Centre Dr
- 1109 Towne Centre Dr
- 0 Tbd 325th St
- 206 Endeavor Ave
- 20 Shiloh Vista Ave
- 103 North St
- 300 N Union Ave
- 112 Shiloh Vista Ave
- 116 Shiloh Vista Ave
- 120 Shiloh Vista Ave
- 124 Shiloh Vista Ave