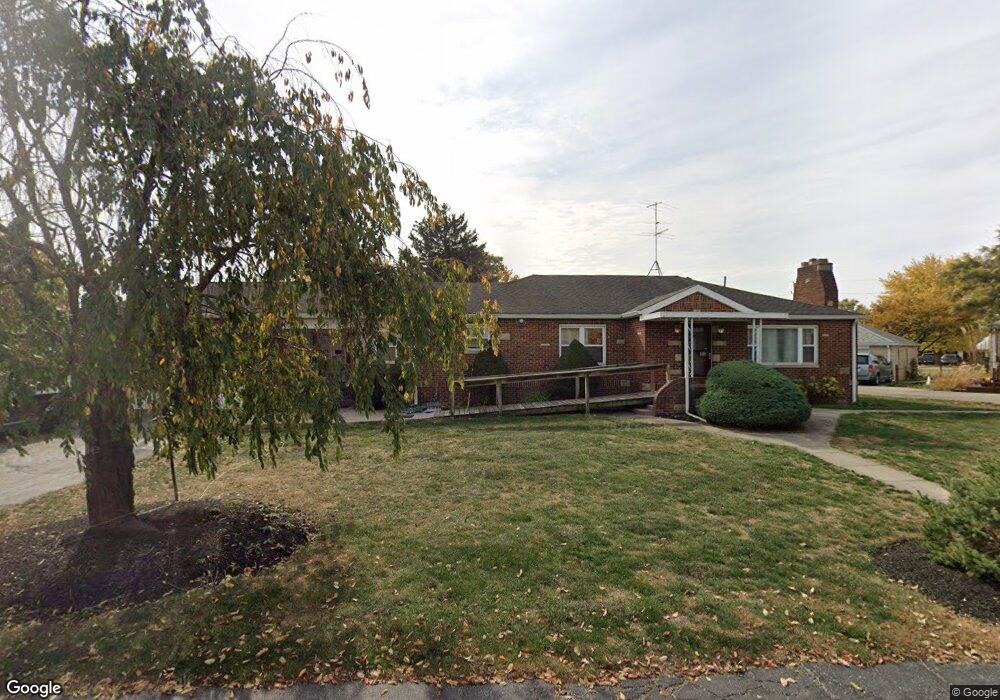
3333 W Troy Ave Indianapolis, IN 46221
Mars Hill NeighborhoodEstimated Value: $135,000 - $521,164
3
Beds
2
Baths
1,854
Sq Ft
$155/Sq Ft
Est. Value
About This Home
This home is located at 3333 W Troy Ave, Indianapolis, IN 46221 and is currently estimated at $287,055, approximately $154 per square foot. 3333 W Troy Ave is a home located in Marion County with nearby schools including Stephen Decatur Elementary School, Decatur Middle School, and Decatur Central High School.
Ownership History
Date
Name
Owned For
Owner Type
Purchase Details
Closed on
Apr 13, 2021
Sold by
Mckinley Cathie M
Bought by
Mckinley Cathie M and Brackney Cristine C
Current Estimated Value
Purchase Details
Closed on
Dec 17, 2020
Sold by
Albrecht Elen M
Bought by
Strakis Mine Llc
Purchase Details
Closed on
Dec 15, 2020
Sold by
Estridge Mackenzie M
Bought by
Strakis Mine Llc
Purchase Details
Closed on
Dec 14, 2020
Sold by
Strakis Russell D
Bought by
Strakis Mine Llc
Purchase Details
Closed on
Dec 11, 2020
Sold by
Nicholas Thomas D
Bought by
Strakis Mine Llc
Purchase Details
Closed on
Dec 9, 2020
Sold by
Rosebrough Anna M
Bought by
Strakis Mine Llc
Purchase Details
Closed on
Dec 3, 2020
Sold by
Vance Connie N
Bought by
Strakis Mine Llc
Purchase Details
Closed on
Dec 2, 2020
Sold by
Nicholas George I
Bought by
Strakis Mine Llc
Purchase Details
Closed on
Dec 1, 2020
Sold by
Strakis Trust
Bought by
Wilkerson Carol A
Create a Home Valuation Report for This Property
The Home Valuation Report is an in-depth analysis detailing your home's value as well as a comparison with similar homes in the area
Home Values in the Area
Average Home Value in this Area
Purchase History
| Date | Buyer | Sale Price | Title Company |
|---|---|---|---|
| Mckinley Cathie M | -- | None Available | |
| Strakis Mine Llc | -- | None Available | |
| Strakis Mine Llc | -- | None Available | |
| Strakis Mine Llc | -- | None Available | |
| Strakis Mine Llc | -- | None Available | |
| Strakis Mine Llc | -- | None Available | |
| Strakis Mine Llc | -- | None Available | |
| Strakis Mine Llc | -- | None Available | |
| Strakis Mine Llc | -- | None Available | |
| Wilkerson Carol A | -- | None Available | |
| Nicholas Thomas D | -- | None Available | |
| Nicholas George I | -- | None Available | |
| Albrecht Ellen N | -- | None Available |
Source: Public Records
Tax History Compared to Growth
Tax History
| Year | Tax Paid | Tax Assessment Tax Assessment Total Assessment is a certain percentage of the fair market value that is determined by local assessors to be the total taxable value of land and additions on the property. | Land | Improvement |
|---|---|---|---|---|
| 2024 | $6,691 | $458,700 | $38,200 | $420,500 |
| 2023 | $6,691 | $413,100 | $38,200 | $374,900 |
| 2022 | $5,572 | $335,800 | $38,200 | $297,600 |
| 2021 | $4,511 | $258,900 | $38,200 | $220,700 |
| 2020 | $4,101 | $258,900 | $38,200 | $220,700 |
| 2019 | $4,038 | $230,700 | $38,200 | $192,500 |
| 2018 | $3,745 | $214,700 | $38,200 | $176,500 |
| 2017 | $3,781 | $216,300 | $38,200 | $178,100 |
| 2016 | $3,695 | $213,900 | $38,200 | $175,700 |
| 2014 | $3,136 | $197,100 | $38,200 | $158,900 |
| 2013 | $2,977 | $197,100 | $38,200 | $158,900 |
Source: Public Records
Map
Nearby Homes
- 3417 Carr Ave
- 3426 Carr Ave
- 3502 Winings Ave
- 3571 W Perry St
- 3005 5th Ave E
- 3551 W Gimber St
- 6900 S Mooresville Rd
- 2646 Maywood Rd
- 3330 S Mooresville Rd
- 2824 S Mcclure St
- 2738 S Mcclure St
- 3301 S Lockburn St
- 3009 Foltz St
- 3345 S Lockburn St
- 3222 Mars Hill St
- 3902 W Mooresville Rd
- 2533 S Mcclure St
- 2914 Collier St
- 2912 Collier St
- 2609 Mars Hill St
- 3045 S Tibbs Ave
- 3343 W Troy Ave
- 3055 S Tibbs Ave
- 3300 W Troy Ave
- 3402 Carr Ave
- 3065 S Tibbs Ave
- 3002 S Tibbs Ave
- 3401 Carr Ave
- 3410 Carr Ave
- 3110 S Tibbs Ave
- 3418 Carr Ave
- 3409 Carr Ave
- 3118 S Tibbs Ave
- 2916 S Tibbs Ave
- 3410 6th Ave E
- 3434 Carr Ave
- 3425 Carr Ave
- 3113 S Tibbs Ave
- 3418 6th Ave E
- 3433 Carr Ave