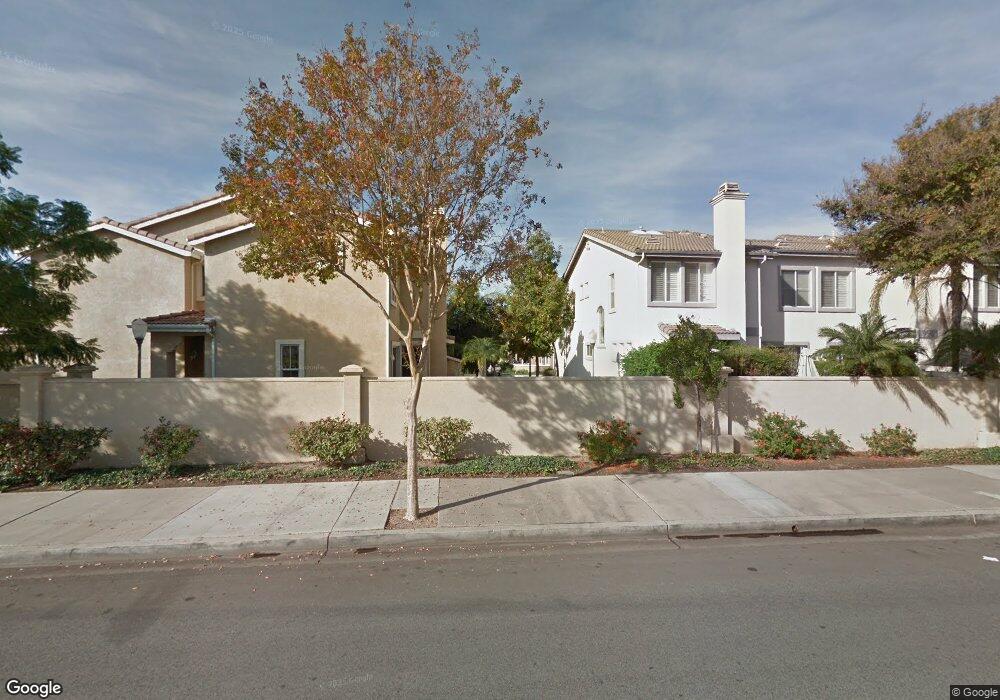
3334 E Chiddingstone Ln Unit B Orange, CA 92869
Estimated Value: $808,682 - $845,000
3
Beds
2
Baths
1,383
Sq Ft
$602/Sq Ft
Est. Value
About This Home
This home is located at 3334 E Chiddingstone Ln Unit B, Orange, CA 92869 and is currently estimated at $832,171, approximately $601 per square foot. 3334 E Chiddingstone Ln Unit B is a home located in Orange County with nearby schools including Prospect Elementary School, El Modena High School, and Orange County Classical Academy.
Ownership History
Date
Name
Owned For
Owner Type
Purchase Details
Closed on
Feb 21, 2003
Sold by
Tran Joseph Cong Minh
Bought by
Tran Chris Pc
Current Estimated Value
Home Financials for this Owner
Home Financials are based on the most recent Mortgage that was taken out on this home.
Original Mortgage
$234,000
Outstanding Balance
$100,070
Interest Rate
5.93%
Estimated Equity
$732,101
Purchase Details
Closed on
Jan 12, 2001
Sold by
Ponder Jeane M
Bought by
Beaudoin Rhonda
Home Financials for this Owner
Home Financials are based on the most recent Mortgage that was taken out on this home.
Original Mortgage
$227,050
Interest Rate
6.89%
Purchase Details
Closed on
Dec 16, 1998
Sold by
Beazer Homes Holdings Corp
Bought by
Tran Joseph Congminh
Home Financials for this Owner
Home Financials are based on the most recent Mortgage that was taken out on this home.
Original Mortgage
$181,850
Interest Rate
6.73%
Create a Home Valuation Report for This Property
The Home Valuation Report is an in-depth analysis detailing your home's value as well as a comparison with similar homes in the area
Home Values in the Area
Average Home Value in this Area
Purchase History
| Date | Buyer | Sale Price | Title Company |
|---|---|---|---|
| Tran Chris Pc | -- | -- | |
| Beaudoin Rhonda | $239,000 | -- | |
| Tran Joseph Congminh | $191,500 | Investors Title Company |
Source: Public Records
Mortgage History
| Date | Status | Borrower | Loan Amount |
|---|---|---|---|
| Open | Tran Chris Pc | $234,000 | |
| Closed | Beaudoin Rhonda | $227,050 | |
| Previous Owner | Tran Joseph Congminh | $181,850 |
Source: Public Records
Tax History
| Year | Tax Paid | Tax Assessment Tax Assessment Total Assessment is a certain percentage of the fair market value that is determined by local assessors to be the total taxable value of land and additions on the property. | Land | Improvement |
|---|---|---|---|---|
| 2025 | $4,892 | $441,731 | $223,162 | $218,569 |
| 2024 | $4,892 | $433,070 | $218,786 | $214,284 |
| 2023 | $4,781 | $424,579 | $214,496 | $210,083 |
| 2022 | $4,686 | $416,254 | $210,290 | $205,964 |
| 2021 | $4,556 | $408,093 | $206,167 | $201,926 |
| 2020 | $4,513 | $403,909 | $204,053 | $199,856 |
| 2019 | $4,457 | $395,990 | $200,052 | $195,938 |
| 2018 | $4,388 | $388,226 | $196,129 | $192,097 |
| 2017 | $4,208 | $380,614 | $192,283 | $188,331 |
| 2016 | $4,126 | $373,151 | $188,512 | $184,639 |
| 2015 | $4,065 | $367,546 | $185,680 | $181,866 |
| 2014 | $3,977 | $360,347 | $182,043 | $178,304 |
Source: Public Records
Map
Nearby Homes
- 448 N Londonderry Ln Unit D
- 425 N Bloomberry
- 3801 E Spring St
- 3139 E Chapman Ave Unit 3B
- 3527 E Barrington Dr
- 195 N Malena Dr
- 692 N Adele St Unit 50
- 692 N Adele St Unit 30
- 692 N Adele St
- 692 N Adele St Unit 78
- 2929 E Hamilton Ave
- 3510 E Berkshire Ct Unit F
- 4024 E Del Valle Ave
- 3410 E Lambeth Ct Unit F
- 235 S Dunas St
- 3509 E Berkshire Ct Unit C
- 244 S Violet Ln
- 756 N Siavohn Dr
- 11851 Earlham St
- 338 S James St
- 3334 E Chiddingstone Ln Unit A
- 3334 E Chiddingstone Ln Unit D
- 3334 E Chiddingstone Ln Unit C
- 3335 E Chiddingstone Ln
- 3335 E Chiddingstone Ln Unit A
- 3335 E Chiddingstone Ln Unit C
- 3335 E Chiddingstone Ln Unit D
- 3329 E Lochleven Ln Unit B
- 3329 E Lochleven Ln Unit C
- 3329 E Lochleven Ln Unit A
- 351 N Wedgewood Ln
- 351 N Wedgewood Ln Unit C
- 351 N Wedgewood Ln Unit A
- 351 N Wedgewood Ln Unit B
- 351 N Wedgewood Ln Unit D
- 3408 E Chiddingstone Ln Unit B
- 448 N Londonderry Ln Unit A
- 448 N Londonderry Ln Unit C
- 3408 E Chiddingstone Ln Unit C
Your Personal Tour Guide
Ask me questions while you tour the home.