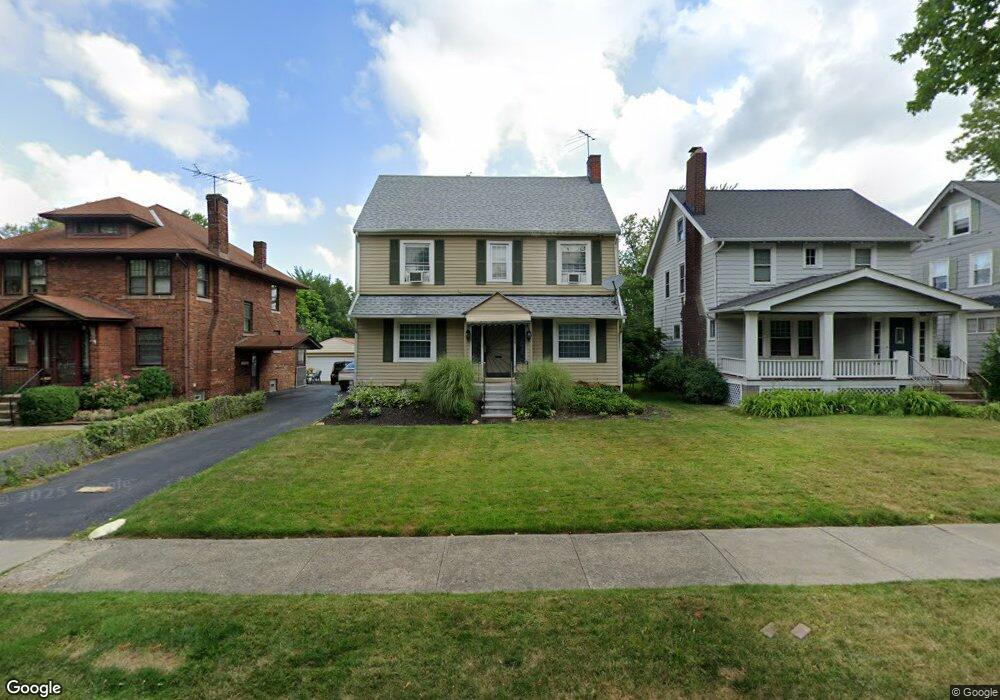
3335 Altamont Ave Cleveland, OH 44118
Estimated Value: $173,000 - $215,000
5
Beds
2
Baths
1,735
Sq Ft
$109/Sq Ft
Est. Value
About This Home
This home is located at 3335 Altamont Ave, Cleveland, OH 44118 and is currently estimated at $189,651, approximately $109 per square foot. 3335 Altamont Ave is a home located in Cuyahoga County with nearby schools including Boulevard Elementary School, Roxboro Middle School, and Cleveland Heights High School.
Ownership History
Date
Name
Owned For
Owner Type
Purchase Details
Closed on
Sep 20, 2005
Sold by
Stevens Charles A
Bought by
Stevens Charles A and Stevens Juanita
Current Estimated Value
Purchase Details
Closed on
Oct 20, 1998
Sold by
Stevens Charles A and Stevens Juanita
Bought by
Stevens Charles A
Home Financials for this Owner
Home Financials are based on the most recent Mortgage that was taken out on this home.
Original Mortgage
$104,000
Interest Rate
6.54%
Mortgage Type
Balloon
Purchase Details
Closed on
Aug 1, 1991
Bought by
Stevens Charles A
Purchase Details
Closed on
Mar 2, 1988
Bought by
Regency Savings Bank,Fsb
Purchase Details
Closed on
Sep 19, 1985
Sold by
Resnick Libby R
Bought by
U S Mutual R E Invest Trust
Purchase Details
Closed on
Jan 1, 1975
Bought by
Resnick Libby R
Create a Home Valuation Report for This Property
The Home Valuation Report is an in-depth analysis detailing your home's value as well as a comparison with similar homes in the area
Home Values in the Area
Average Home Value in this Area
Purchase History
| Date | Buyer | Sale Price | Title Company |
|---|---|---|---|
| Stevens Charles A | -- | Public | |
| Stevens Charles A | -- | Heights Title Agency Inc | |
| Stevens Charles A | -- | -- | |
| Regency Savings Bank,Fsb | -- | -- | |
| U S Mutual R E Invest Trust | $44,900 | -- | |
| Resnick Libby R | -- | -- |
Source: Public Records
Mortgage History
| Date | Status | Borrower | Loan Amount |
|---|---|---|---|
| Closed | Stevens Charles A | $104,000 | |
| Closed | Stevens Charles A | $26,000 |
Source: Public Records
Tax History Compared to Growth
Tax History
| Year | Tax Paid | Tax Assessment Tax Assessment Total Assessment is a certain percentage of the fair market value that is determined by local assessors to be the total taxable value of land and additions on the property. | Land | Improvement |
|---|---|---|---|---|
| 2024 | $5,315 | $54,250 | $12,110 | $42,140 |
| 2023 | $5,623 | $47,500 | $10,540 | $36,960 |
| 2022 | $5,146 | $47,500 | $10,540 | $36,960 |
| 2021 | $5,041 | $47,500 | $10,540 | $36,960 |
| 2020 | $5,055 | $38,330 | $8,510 | $29,820 |
| 2019 | $4,513 | $109,500 | $24,300 | $85,200 |
| 2018 | $4,444 | $38,330 | $8,510 | $29,820 |
| 2017 | $4,443 | $37,180 | $8,020 | $29,160 |
| 2016 | $4,434 | $37,180 | $8,020 | $29,160 |
| 2015 | $4,510 | $37,180 | $8,020 | $29,160 |
| 2014 | $4,510 | $39,970 | $8,610 | $31,360 |
Source: Public Records
Map
Nearby Homes
- 3326 Beechwood Ave
- 3365 Desota Ave
- 3328 Altamont Ave
- 3388 Beechwood Ave Unit 2
- 3320 Beechwood Ave
- 3383 Beechwood Ave
- 3356 Euclid Heights Blvd
- 3423 Beechwood Ave
- 3412 Euclid Heights Blvd
- 3264 Altamont Ave
- 3263 Desota Ave
- 3246 Altamont Ave
- 3483 Severn Rd
- 1659 Ivydale Rd
- 1683 Colonial Dr
- 3484 Berkeley Rd
- 3215 Euclid Heights Blvd
- 1602 Rydalmount Rd
- 3235 Oak Rd
- 3484 Bainbridge Rd
- 3331 Altamont Ave
- 3339 Altamont Ave
- 3327 Altamont Ave
- 3341 Altamont Ave
- 3323 Altamont Ave
- 3324 Beechwood Ave
- 3338 Beechwood Ave
- 3319 Altamont Ave
- 3344 Beechwood Ave
- 3344 Beechwood Ave Unit 227
- 3322 Beechwood Ave
- 3353 Altamont Ave
- 3334 Altamont Ave
- 3340 Altamont Ave
- 3315 Altamont Ave
- 3344 Altamont Ave
- 3324 Altamont Ave
- 3348 Altamont Ave
- 3322 Altamont Ave
- 3311 Altamont Ave