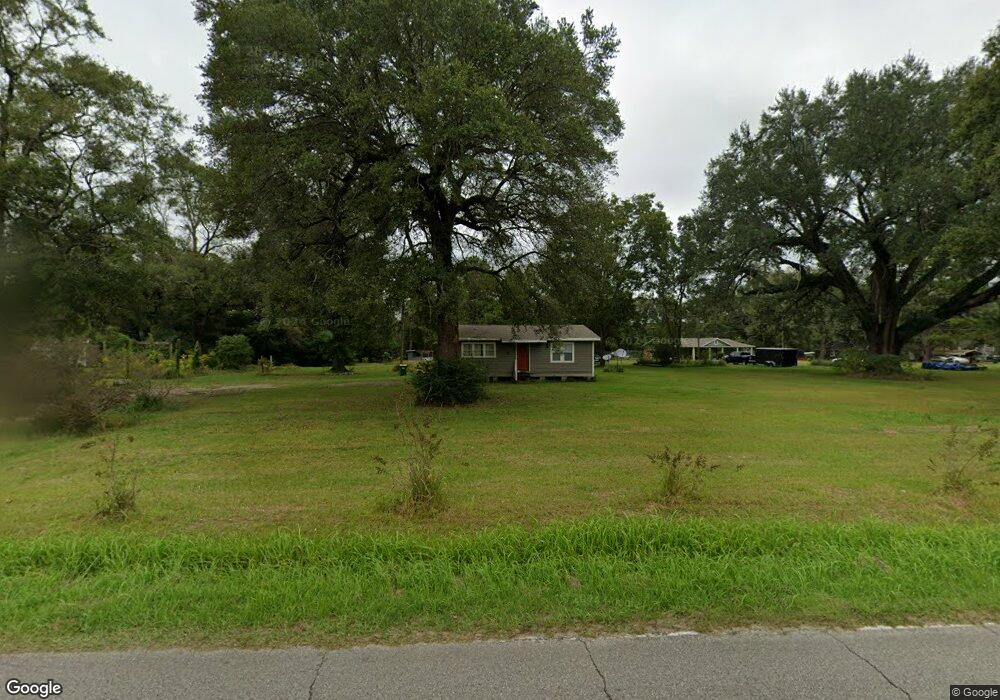
3335 Big Point Rd Unit 1 Moss Point, MS 39562
Estimated Value: $83,000 - $104,000
3
Beds
1
Bath
1,003
Sq Ft
$95/Sq Ft
Est. Value
About This Home
This home is located at 3335 Big Point Rd Unit 1, Moss Point, MS 39562 and is currently estimated at $95,378, approximately $95 per square foot. 3335 Big Point Rd Unit 1 is a home located in Jackson County with nearby schools including East Central Lower Elementary School, East Central Upper Elementary School, and East Central Middle School.
Ownership History
Date
Name
Owned For
Owner Type
Purchase Details
Closed on
Feb 6, 2024
Sold by
Mcdaniel Dennis
Bought by
Roberts Taylor Lane
Current Estimated Value
Home Financials for this Owner
Home Financials are based on the most recent Mortgage that was taken out on this home.
Original Mortgage
$83,460
Outstanding Balance
$81,654
Interest Rate
6.61%
Mortgage Type
New Conventional
Estimated Equity
$13,724
Purchase Details
Closed on
Nov 6, 2023
Sold by
Mcdaniel Dennis W and Mcdaniel Amber N
Bought by
Mcdaniel Dennis
Purchase Details
Closed on
Nov 5, 2018
Sold by
Goosman Rebecca A
Bought by
Mcdaniel Dennis W and Mcdaniel Amber N
Home Financials for this Owner
Home Financials are based on the most recent Mortgage that was taken out on this home.
Original Mortgage
$72,727
Interest Rate
4.7%
Mortgage Type
New Conventional
Create a Home Valuation Report for This Property
The Home Valuation Report is an in-depth analysis detailing your home's value as well as a comparison with similar homes in the area
Purchase History
| Date | Buyer | Sale Price | Title Company |
|---|---|---|---|
| Roberts Taylor Lane | -- | None Listed On Document | |
| Mcdaniel Dennis | -- | None Listed On Document | |
| Mcdaniel Dennis | -- | None Listed On Document | |
| Mcdaniel Dennis W | -- | -- |
Source: Public Records
Mortgage History
| Date | Status | Borrower | Loan Amount |
|---|---|---|---|
| Open | Roberts Taylor Lane | $83,460 | |
| Previous Owner | Mcdaniel Dennis W | $72,727 |
Source: Public Records
Tax History
| Year | Tax Paid | Tax Assessment Tax Assessment Total Assessment is a certain percentage of the fair market value that is determined by local assessors to be the total taxable value of land and additions on the property. | Land | Improvement |
|---|---|---|---|---|
| 2025 | $278 | $3,551 | $803 | $2,748 |
| 2024 | $278 | $4,967 | $1,172 | $3,795 |
| 2023 | $596 | $4,967 | $1,172 | $3,795 |
| 2022 | $248 | $3,311 | $781 | $2,530 |
| 2021 | $251 | $3,334 | $781 | $2,553 |
| 2020 | $242 | $2,999 | $710 | $2,289 |
| 2019 | $238 | $2,999 | $710 | $2,289 |
| 2018 | $229 | $2,868 | $710 | $2,158 |
| 2017 | $235 | $2,868 | $710 | $2,158 |
| 2016 | $221 | $2,868 | $710 | $2,158 |
| 2015 | $191 | $24,510 | $7,100 | $17,410 |
| 2014 | $186 | $2,451 | $710 | $1,741 |
| 2013 | $176 | $2,451 | $710 | $1,741 |
Source: Public Records
Map
Nearby Homes
- 17209 Red Top Ln
- 0 Big Point Unit 4125782
- 3016 Ed Parker Rd
- 0 Grafe Homestead Rd Unit 4137349
- 14004 Timber Ridge Dr
- 13875 Wolf Ridge Rd Unit LotWP001
- 13875 Wolf Ridge Rd
- 0 Perry St
- 7201 Bentwood Dr
- 13600 Reservoir Rd E
- 4432 Lily Patch Ln
- 26.1 Acres Brinkman Rd E
- 0 Ms-613 Hwy Unit 4116583
- 0 Ms-613 Hwy Unit 4107607
- 0 Ms-613 Hwy Unit 4107612
- 0 Ms-613 Hwy Unit 4116582
- 7605 Methodist Church Rd
- 0 R B Dickerson Rd
- 0 Dr Unit 4052148
- 01 Dap Rd E
- 3335 Big Point Rd
- 3335 Big Point Rd
- 16707 Kelly Ct
- 3333 Big Point Rd
- 16708 Kelly Ct
- 3412 Big Point Rd
- 16711 Kelly Ct
- 3433 Big Point Rd
- 3321 Big Point Rd
- 16800 Shenandoah Rd
- 3428 Big Point Rd
- 3521 Big Point Rd
- 16700 Lone Rock Dr
- 3309 Big Point Rd
- 16521 Kelly Ct
- 16801 Shenandoah Rd
- 3320 Big Point Rd
- 3625 Big Point Rd Unit DRO
- 3611 Big Point Rd
- 16717 Kelly Ct