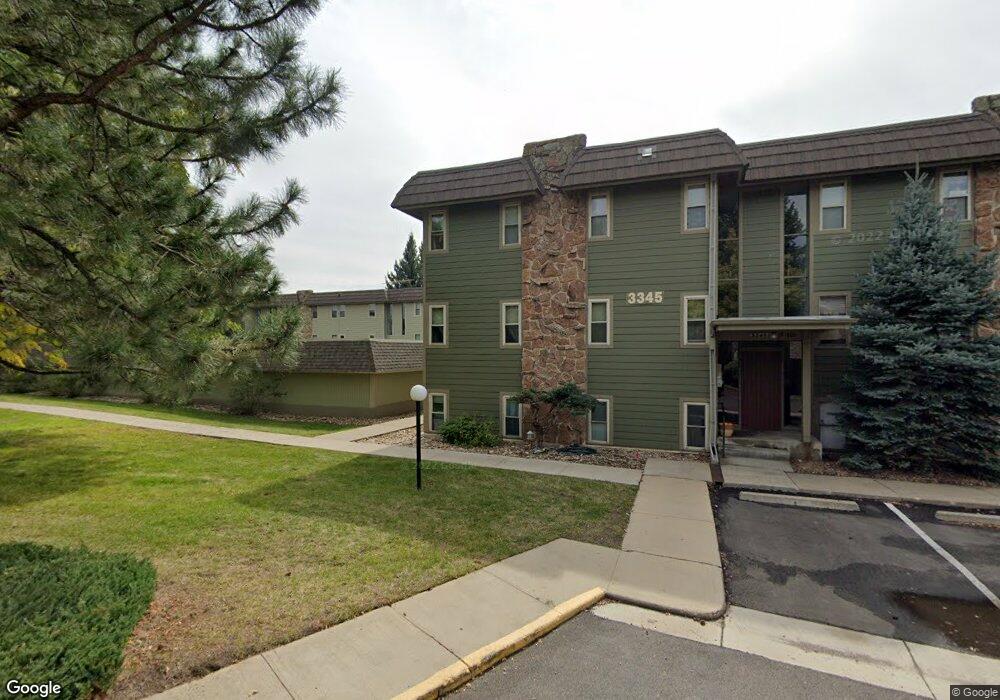
3335 Chisholm Trail Unit D301 Boulder, CO 80301
Palo Park NeighborhoodEstimated Value: $289,289 - $362,000
2
Beds
1
Bath
862
Sq Ft
$385/Sq Ft
Est. Value
About This Home
This home is located at 3335 Chisholm Trail Unit D301, Boulder, CO 80301 and is currently estimated at $331,822, approximately $384 per square foot. 3335 Chisholm Trail Unit D301 is a home located in Boulder County with nearby schools including Columbine Elementary School, Casey Middle School, and Boulder High School.
Ownership History
Date
Name
Owned For
Owner Type
Purchase Details
Closed on
May 3, 1999
Sold by
Hanna Detmar Hanna Donna and Blair Hanna R
Bought by
Ryland Kathleen E
Current Estimated Value
Home Financials for this Owner
Home Financials are based on the most recent Mortgage that was taken out on this home.
Original Mortgage
$71,250
Outstanding Balance
$18,455
Interest Rate
7.07%
Estimated Equity
$313,367
Purchase Details
Closed on
Aug 12, 1994
Sold by
Sarubbi Constance Mcn and Giordani Margaret B
Bought by
Detmar Hanna Donna
Home Financials for this Owner
Home Financials are based on the most recent Mortgage that was taken out on this home.
Original Mortgage
$60,000
Interest Rate
5.87%
Purchase Details
Closed on
Sep 9, 1987
Bought by
Ryland Kathleen E
Purchase Details
Closed on
Oct 13, 1978
Bought by
Ryland Kathleen E
Create a Home Valuation Report for This Property
The Home Valuation Report is an in-depth analysis detailing your home's value as well as a comparison with similar homes in the area
Home Values in the Area
Average Home Value in this Area
Purchase History
| Date | Buyer | Sale Price | Title Company |
|---|---|---|---|
| Ryland Kathleen E | $95,000 | -- | |
| Detmar Hanna Donna | $86,000 | -- | |
| Ryland Kathleen E | $46,000 | -- | |
| Ryland Kathleen E | $41,500 | -- |
Source: Public Records
Mortgage History
| Date | Status | Borrower | Loan Amount |
|---|---|---|---|
| Open | Ryland Kathleen E | $71,250 | |
| Previous Owner | Detmar Hanna Donna | $60,000 |
Source: Public Records
Tax History
| Year | Tax Paid | Tax Assessment Tax Assessment Total Assessment is a certain percentage of the fair market value that is determined by local assessors to be the total taxable value of land and additions on the property. | Land | Improvement |
|---|---|---|---|---|
| 2025 | $1,021 | $20,350 | -- | $20,350 |
| 2024 | $1,021 | $20,350 | -- | $20,350 |
| 2023 | $1,004 | $18,321 | -- | $22,006 |
| 2022 | $1,288 | $20,822 | $0 | $20,822 |
| 2021 | $1,228 | $21,421 | $0 | $21,421 |
| 2020 | $1,111 | $19,913 | $0 | $19,913 |
| 2019 | $1,094 | $19,913 | $0 | $19,913 |
| 2018 | $800 | $16,430 | $0 | $16,430 |
| 2017 | $1,380 | $18,165 | $0 | $18,165 |
| 2016 | $1,114 | $12,871 | $0 | $12,871 |
| 2015 | $1,055 | $11,454 | $0 | $11,454 |
| 2014 | $963 | $11,454 | $0 | $11,454 |
Source: Public Records
Map
Nearby Homes
- 3250 Oneal Cir Unit 25J
- 3250 Oneal Cir Unit H17
- 3120 Corona Trail Unit L103
- 3335 Chisholm Trail Unit D202
- 3345 Chisholm Trail Unit C206
- 3050 Corona Trail
- 3050 Corona Trail Unit M107
- 3035 Oneal Pkwy Unit V35
- 3035 Oneal Pkwy Unit T11
- 3035 Oneal Pkwy Unit T21
- 3035 Oneal Pkwy Unit 37V
- 3316 Hickok Place
- 3365 Chisholm Trail Unit B304
- 3150 Iris Ave Unit F305
- 3150 Iris Ave Unit F307
- 3355 Bridger Trail Unit I202
- 3295 34th St Unit 68
- 3295 34th St Unit 62
- 3240 Iris Ave Unit G205
- 3240 Iris Ave Unit G201
- 3335 Chisholm Trail Unit D306
- 3335 Chisholm Trail Unit D305
- 3335 Chisholm Trail Unit D304
- 3335 Chisholm Trail Unit D303
- 3335 Chisholm Trail Unit D302
- 3335 Chisholm Trail Unit D205
- 3335 Chisholm Trail Unit D204
- 3335 Chisholm Trail Unit D203
- 3335 Chisholm Trail Unit D201
- 3335 Chisholm Trail Unit D106
- 3335 Chisholm Trail Unit D105
- 3335 Chisholm Trail Unit D103
- 3335 Chisholm Trail Unit D102
- 3335 Chisholm Trail Unit D101
- 3335 Chisholm Trail Unit 203
- 3315 Chisholm Trail Unit 304E
- 3315 Chisholm Trail Unit 303E
- 3315 Chisholm Trail Unit 302E
- 3315 Chisholm Trail Unit 301E
- 3315 Chisholm Trail Unit 204E
Your Personal Tour Guide
Ask me questions while you tour the home.