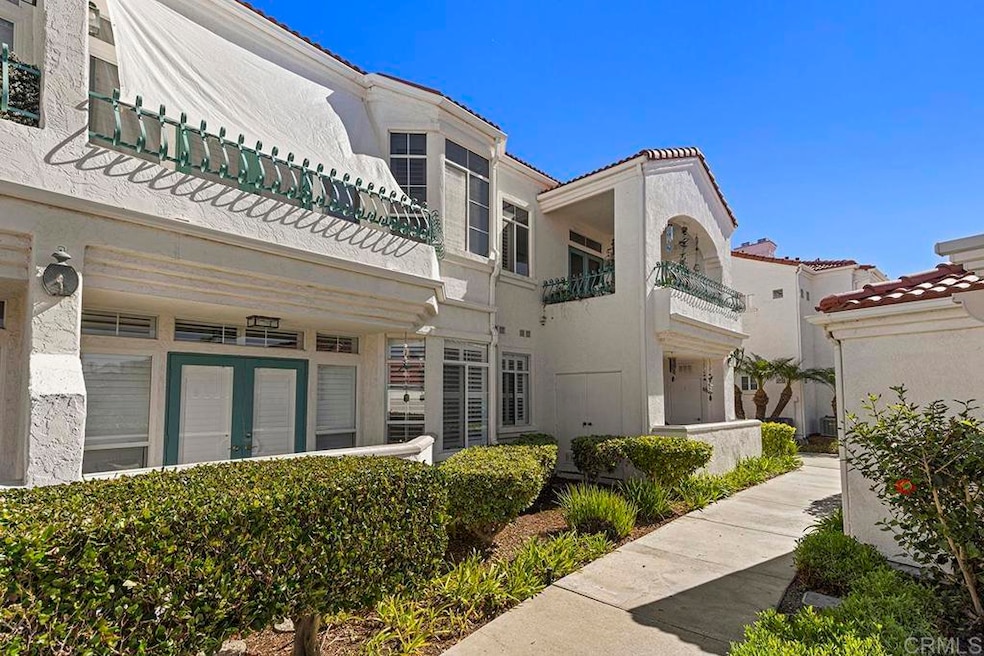
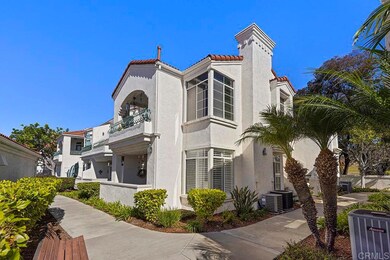
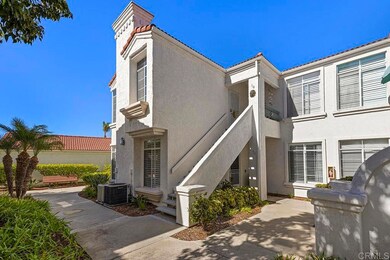
3335 Genoa Way Unit 111 Oceanside, CA 92056
Mira Costa NeighborhoodEstimated payment $4,111/month
Highlights
- Heated Pool
- Primary Bedroom Suite
- 2.12 Acre Lot
- Active Adult
- Gated Community
- Clubhouse
About This Home
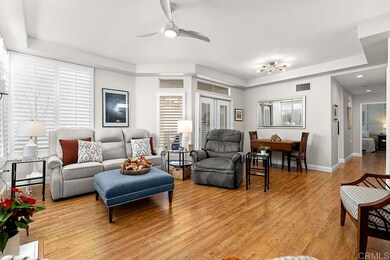
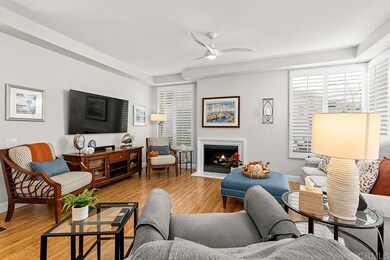
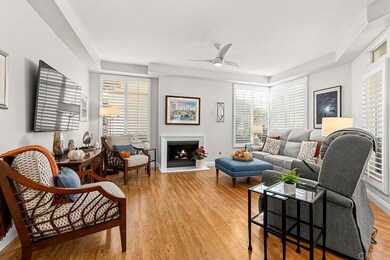
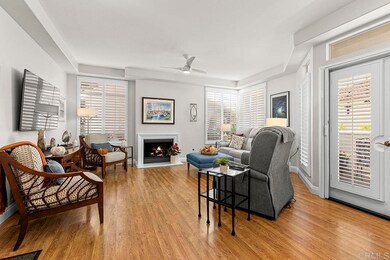
Beautifully and highly upgraded turnkey two bedroom and two bathroom condo with two outdoor patios off the living room and primary bedroom and perfectly located on first level of the desirable 55+ gated community of Villa Trieste. You’ll be impressed with designer upgrades, custom paint colors and high-end finishes throughout. Both the kitchen and the bathrooms have been recently completely updated with custom tile, quartz countertops, new appliances and glass tile backsplash. The master bathroom is handicap assessable with roll in shower. Enjoy a whole home water filtration system, a newer A/C unit and heater, and hot water tank. Wood plantation shutters on all of the numerous windows throughout, ceiling fans in each room, wood laminate flooring and recessed lighting. There is a mantled gas fireplace in the living room, a full size washer and dryer in the home and a one car garage with storage cabinets and a ceiling storage rack. An extra outdoor parking space comes with the property. Garage has a keypad automatic entry. Villa Triest portrays a coastal vibe with white-washed architecture, newly installed red tile roofs and meticulously maintained tropical landscaping and coastal breezes. The amenities include a clubhouse, pool, spa, picinic BBQ area, Bocce Ball Court and Gazebo. The ideal location provides close proximity and convenience to most everything you’ll need.
Listing Agent
Allison James Estates & Homes Brokerage Email: debgaddisrealtor@gmail.com License #01477918 Listed on: 10/22/2025

Property Details
Home Type
- Condominium
Est. Annual Taxes
- $3,632
Year Built
- Built in 1991
Lot Details
- 1 Common Wall
HOA Fees
- $425 Monthly HOA Fees
Parking
- 1 Car Garage
- 1 Carport Space
- Automatic Gate
Home Design
- Entry on the 1st floor
Interior Spaces
- 1,016 Sq Ft Home
- 1-Story Property
- Gas Fireplace
- Living Room
- Laundry Room
Bedrooms and Bathrooms
- 2 Bedrooms | 1 Primary Bedroom on Main
- Primary Bedroom Suite
- Walk-In Closet
- 2 Full Bathrooms
Pool
- Heated Pool
- Spa
Outdoor Features
- Exterior Lighting
- Rain Gutters
Utilities
- Forced Air Heating and Cooling System
- Hot Water Heating System
Listing and Financial Details
- Tax Tract Number 12386
- Assessor Parcel Number 1657014333
- $390 per year additional tax assessments
- Seller Considering Concessions
Community Details
Overview
- Active Adult
- 150 Units
- Villa Trieste HOA, Phone Number (760) 585-1700
- Maintained Community
Amenities
- Outdoor Cooking Area
- Community Barbecue Grill
- Clubhouse
- Banquet Facilities
- Meeting Room
- Card Room
Recreation
- Bocce Ball Court
- Community Pool
- Community Spa
Pet Policy
- Pets Allowed with Restrictions
Security
- Resident Manager or Management On Site
- Controlled Access
- Gated Community
Map
Home Values in the Area
Average Home Value in this Area
Tax History
| Year | Tax Paid | Tax Assessment Tax Assessment Total Assessment is a certain percentage of the fair market value that is determined by local assessors to be the total taxable value of land and additions on the property. | Land | Improvement |
|---|---|---|---|---|
| 2025 | $3,632 | $302,832 | $177,268 | $125,564 |
| 2024 | $3,632 | $296,895 | $173,793 | $123,102 |
| 2023 | $3,529 | $291,075 | $170,386 | $120,689 |
| 2022 | $3,480 | $285,369 | $167,046 | $118,323 |
| 2021 | $3,491 | $279,774 | $163,771 | $116,003 |
| 2020 | $3,393 | $276,906 | $162,092 | $114,814 |
| 2019 | $3,304 | $271,477 | $158,914 | $112,563 |
| 2018 | $3,271 | $266,155 | $155,799 | $110,356 |
| 2017 | $3,217 | $260,938 | $152,745 | $108,193 |
| 2016 | $3,122 | $255,822 | $149,750 | $106,072 |
| 2015 | $3,041 | $251,980 | $147,501 | $104,479 |
| 2014 | $2,951 | $247,045 | $144,612 | $102,433 |
Property History
| Date | Event | Price | List to Sale | Price per Sq Ft |
|---|---|---|---|---|
| 10/24/2025 10/24/25 | Pending | -- | -- | -- |
| 10/22/2025 10/22/25 | For Sale | $645,000 | -- | $635 / Sq Ft |
Purchase History
| Date | Type | Sale Price | Title Company |
|---|---|---|---|
| Grant Deed | $638,000 | First American Title | |
| Interfamily Deed Transfer | -- | -- | |
| Grant Deed | $205,000 | Southland Title | |
| Grant Deed | $118,000 | Southland Title | |
| Interfamily Deed Transfer | -- | Southland Title | |
| Deed | $139,000 | -- |
Mortgage History
| Date | Status | Loan Amount | Loan Type |
|---|---|---|---|
| Open | $510,400 | New Conventional | |
| Previous Owner | $112,100 | Purchase Money Mortgage |
Source: California Regional Multiple Listing Service (CRMLS)
MLS Number: NDP2510160
APN: 165-701-43-33
Disclaimer: Certain information contained herein is derived from information provided by parties other than Homes.com. All information provided is deemed reliable, but is not guaranteed to be accurate and should be independently verified.
![]() The multiple listing data appearing on this website, or contained in reports produced therefrom, is owned and copyrighted by California Regional Multiple Listing Service, Inc. ("CRMLS") and is protected by all applicable copyright laws. Information provided is for viewer's personal, non-commercial use and may not be used for any purpose other than to identify prospective properties the viewer may be interested in purchasing. All listing data, including but not limited to square footage and lot size is believed to be accurate, but the listing Agent, listing Broker and CRMLS and its affiliates do not warrant or guarantee such accuracy. The viewer should independently verify the listed data prior to making any decisions based on such information by personal inspection and/or contacting a real estate professional.
The multiple listing data appearing on this website, or contained in reports produced therefrom, is owned and copyrighted by California Regional Multiple Listing Service, Inc. ("CRMLS") and is protected by all applicable copyright laws. Information provided is for viewer's personal, non-commercial use and may not be used for any purpose other than to identify prospective properties the viewer may be interested in purchasing. All listing data, including but not limited to square footage and lot size is believed to be accurate, but the listing Agent, listing Broker and CRMLS and its affiliates do not warrant or guarantee such accuracy. The viewer should independently verify the listed data prior to making any decisions based on such information by personal inspection and/or contacting a real estate professional.
Based on information from California Regional Multiple Listing Service, Inc. and /or other sources. All data, including all measurements and calculations of area, is obtained from various sources and has not been, and will not be, verified by broker or MLS. All information should be independently reviewed and verified for accuracy. Properties may or may not be listed by the office/agent presenting the information
- 3335 Genoa Way Unit 112
- 3315 Genoa Way Unit 96
- 3325 Genoa Way Unit 110
- 3376 Corsica Way
- 3328 Malta Way
- 3159 Calle Osuna Unit 4
- 3560 Santa Maria St
- 3575 Cameo Dr Unit 45
- 2332 Back Nine St
- 2187 Castilla Way
- 3209 Buena Hills Dr
- 2188 Anda Lucia Way
- 2175 Castilla Way
- 3711 Mira Pacific Dr
- 3648 Mira Pacific Dr
- 3694 Mira Pacific Dr
- 3547 Mira Pacific Dr
- 3651 North Way
- 3553 Paseo de Francisco Unit 210
- 3549 Paseo de Francisco Unit 224