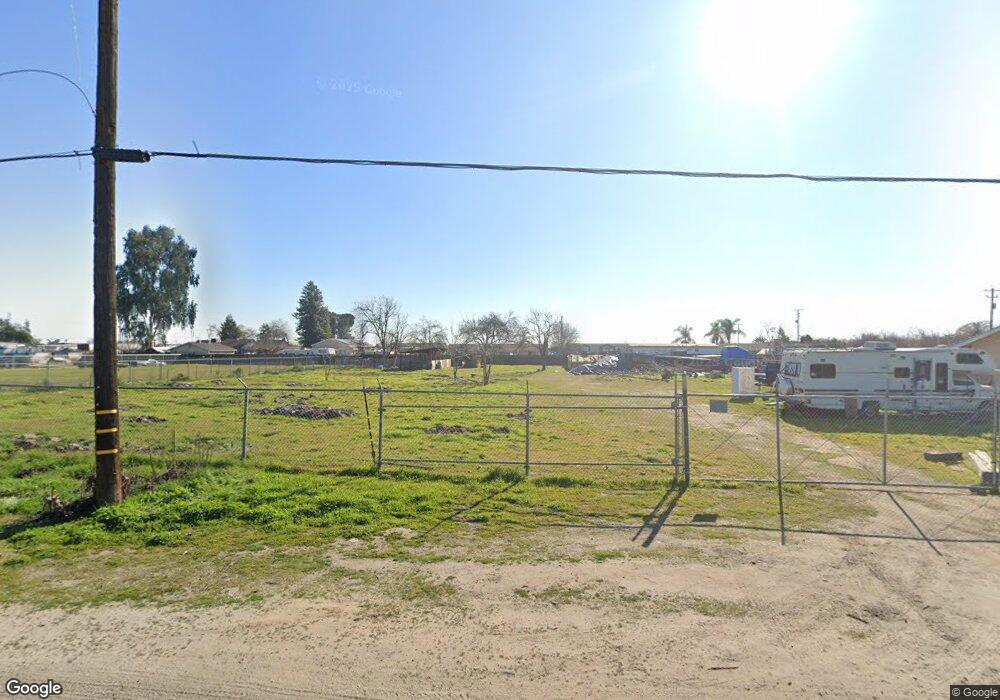
3335 W Muscat Ave Fresno, CA 93706
Estimated Value: $40,000 - $46,000
3
Beds
2
Baths
1,776
Sq Ft
$24/Sq Ft
Est. Value
About This Home
This home is located at 3335 W Muscat Ave, Fresno, CA 93706 and is currently estimated at $42,612, approximately $23 per square foot. 3335 W Muscat Ave is a home located in Fresno County with nearby schools including West Park Elementary School, Washington High School, and West Park Charter Academy.
Ownership History
Date
Name
Owned For
Owner Type
Purchase Details
Closed on
Jun 5, 2023
Sold by
Taylor Isaac Samuel
Bought by
Anaya Alexander Parra
Current Estimated Value
Purchase Details
Closed on
May 13, 2022
Sold by
Louvenia Hilliard
Bought by
Taylor Isaac Samuel
Purchase Details
Closed on
Feb 27, 2014
Sold by
Vardanyan Barkey
Bought by
Padilla Arturo Parra and Deparra Evelia Anaya
Home Financials for this Owner
Home Financials are based on the most recent Mortgage that was taken out on this home.
Original Mortgage
$153,000
Interest Rate
4.32%
Mortgage Type
New Conventional
Purchase Details
Closed on
Dec 30, 2011
Sold by
Wells Fargo Bank Na
Bought by
Federal Home Loan Mortgage Corporation
Purchase Details
Closed on
Jun 24, 1996
Sold by
Ali Aalyiah and Hilliard Lola
Bought by
Ali Aalyiah
Home Financials for this Owner
Home Financials are based on the most recent Mortgage that was taken out on this home.
Original Mortgage
$52,000
Interest Rate
8.09%
Create a Home Valuation Report for This Property
The Home Valuation Report is an in-depth analysis detailing your home's value as well as a comparison with similar homes in the area
Home Values in the Area
Average Home Value in this Area
Purchase History
| Date | Buyer | Sale Price | Title Company |
|---|---|---|---|
| Anaya Alexander Parra | $35,000 | Chicago Title | |
| Taylor Isaac Samuel | -- | None Listed On Document | |
| Padilla Arturo Parra | $180,000 | Stewart Title Of Ca Inc | |
| Federal Home Loan Mortgage Corporation | -- | Accommodation | |
| Ali Aalyiah | -- | North American Title Co |
Source: Public Records
Mortgage History
| Date | Status | Borrower | Loan Amount |
|---|---|---|---|
| Previous Owner | Padilla Arturo Parra | $153,000 | |
| Previous Owner | Ali Aalyiah | $52,000 |
Source: Public Records
Tax History Compared to Growth
Tax History
| Year | Tax Paid | Tax Assessment Tax Assessment Total Assessment is a certain percentage of the fair market value that is determined by local assessors to be the total taxable value of land and additions on the property. | Land | Improvement |
|---|---|---|---|---|
| 2025 | $421 | $36,414 | $36,414 | -- |
| 2023 | $1,213 | $107,100 | $102,000 | $5,100 |
| 2022 | $140 | $8,409 | $6,716 | $1,693 |
| 2021 | $480 | $38,786 | $6,585 | $32,201 |
| 2020 | $454 | $38,389 | $6,518 | $31,871 |
| 2019 | $448 | $37,638 | $6,391 | $31,247 |
| 2018 | $441 | $36,901 | $6,266 | $30,635 |
| 2017 | $431 | $36,179 | $6,144 | $30,035 |
| 2016 | $423 | $35,471 | $6,024 | $29,447 |
| 2015 | $414 | $34,939 | $5,934 | $29,005 |
| 2014 | $405 | $34,255 | $5,818 | $28,437 |
Source: Public Records
Map
Nearby Homes
- 2680 W Malaga Ave
- 4510 W Muscat Ave
- 2233 S Valentine Ave
- 1722 S Brawley Ave
- 4114 W Church Ave
- 1740 S Cornelia Ave
- 3155 S Walnut Ave
- 2564 S Habitat Ave
- 2432 S Walnut Ave
- 6066 S Cornelia Ave
- 2990 S Martin Luther King Junior Blvd
- 0 Moc: Mission Ranch Unit 629384
- 106 W Church
- 998 E Jolson Ave
- 3017 W Oleander Ave
- 385 W Almy Ave
- 4611 W Kearney Blvd
- 2390 S Walnut Ave
- 87 E Florence Ave
- 75 E Florence Ave
- 3335 W Muscat Ave
- 3336 W Beran Way
- 3310 W Beran Way
- 3360 W Beran Way
- 3301 W Muscat Ave
- 3357 W Muscat Ave
- 3304 W Beran Way
- 3436 S Valentine Ave
- 3285 W Muscat Ave
- 3456 S Valentine Ave
- 3313 W Beran Way
- 3353 W Beran Way
- 3305 W Beran Way
- 3283 W Beran Way
- 3250 W Beran Way
- 3500 S Valentine Ave
- 3247 W Muscat Ave
- 3239 W Muscat Ave
- 3251 W Beran Way
- 3233 W Muscat Ave