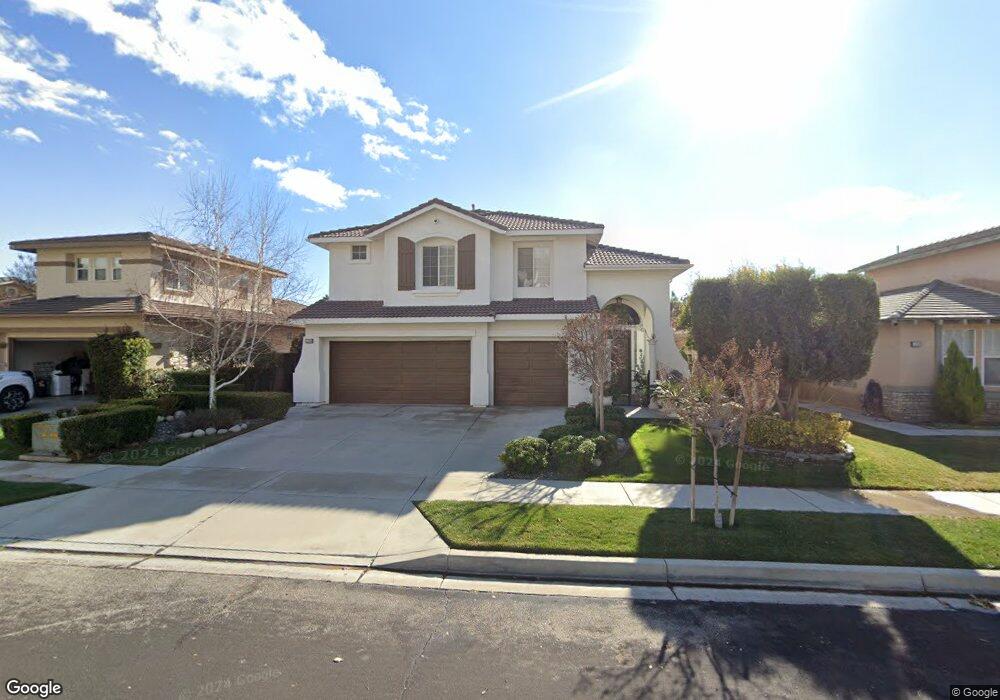
33369 Warwick Hills Rd Yucaipa, CA 92399
Estimated Value: $573,204 - $608,000
4
Beds
3
Baths
2,110
Sq Ft
$282/Sq Ft
Est. Value
About This Home
This home is located at 33369 Warwick Hills Rd, Yucaipa, CA 92399 and is currently estimated at $594,801, approximately $281 per square foot. 33369 Warwick Hills Rd is a home located in San Bernardino County with nearby schools including Chapman Heights Elementary, Park View Middle School, and Yucaipa High School.
Ownership History
Date
Name
Owned For
Owner Type
Purchase Details
Closed on
Oct 8, 2020
Sold by
Toro Joe John Del and Toro Joann Lorraine
Bought by
Rlt Joe and Rlt Joann
Current Estimated Value
Purchase Details
Closed on
Feb 26, 2007
Sold by
Deltoro Joe John and Deltoro Del Toro
Bought by
Deltoro Joe John and Deltoro Del Toro
Home Financials for this Owner
Home Financials are based on the most recent Mortgage that was taken out on this home.
Original Mortgage
$250,000
Outstanding Balance
$150,907
Interest Rate
6.21%
Mortgage Type
New Conventional
Estimated Equity
$443,894
Purchase Details
Closed on
May 12, 2000
Sold by
Osborne Development Corp
Bought by
Deltoro Joe John and Deltoro Joann Lorraine
Home Financials for this Owner
Home Financials are based on the most recent Mortgage that was taken out on this home.
Original Mortgage
$150,000
Interest Rate
7.6%
Create a Home Valuation Report for This Property
The Home Valuation Report is an in-depth analysis detailing your home's value as well as a comparison with similar homes in the area
Home Values in the Area
Average Home Value in this Area
Purchase History
| Date | Buyer | Sale Price | Title Company |
|---|---|---|---|
| Rlt Joe | -- | None Available | |
| Deltoro Joe John | -- | Ticor Title Co | |
| Deltoro Joe John | $251,000 | First American Title Ins Co |
Source: Public Records
Mortgage History
| Date | Status | Borrower | Loan Amount |
|---|---|---|---|
| Open | Deltoro Joe John | $250,000 | |
| Closed | Deltoro Joe John | $150,000 |
Source: Public Records
Tax History Compared to Growth
Tax History
| Year | Tax Paid | Tax Assessment Tax Assessment Total Assessment is a certain percentage of the fair market value that is determined by local assessors to be the total taxable value of land and additions on the property. | Land | Improvement |
|---|---|---|---|---|
| 2025 | $5,352 | $385,155 | $107,592 | $277,563 |
| 2024 | $5,352 | $377,603 | $105,482 | $272,121 |
| 2023 | $5,876 | $370,199 | $103,414 | $266,785 |
| 2022 | $5,508 | $362,940 | $101,386 | $261,554 |
| 2021 | $5,772 | $355,823 | $99,398 | $256,425 |
| 2020 | $5,811 | $352,175 | $98,379 | $253,796 |
| 2019 | $5,682 | $345,270 | $96,450 | $248,820 |
| 2018 | $5,249 | $338,500 | $94,559 | $243,941 |
| 2017 | $5,160 | $331,863 | $92,705 | $239,158 |
| 2016 | $5,140 | $325,356 | $90,887 | $234,469 |
| 2015 | $5,127 | $320,469 | $89,522 | $230,947 |
| 2014 | $4,802 | $314,191 | $87,768 | $226,423 |
Source: Public Records
Map
Nearby Homes
- 11780 Fairway Dr
- 11718 Pactfield Place
- 33353 Wallace Way
- 11967 Southwind Way
- 92399 Yucaipa Blvd
- 11634 Wiggins Ct
- 33825 Cansler Way
- 33540 Washington Dr
- 11811 Cramer Rd
- 11692 Bluegrass Rd
- 12422 Stardell Ln
- 34015 Pinehurst Dr
- 34107 Lake Breeze Dr
- 12510 8th St
- 34075 Lily Rd Unit 37
- 34083 Lily Rd Unit 33
- 34177 Pinehurst Dr
- 12419 13th St
- 36551 Avenue E
- 34280 Forest Oaks Dr
- 33377 Warwick Hills Rd
- 33361 Warwick Hills Rd
- 33353 Warwick Hills Rd
- 33385 Warwick Hills Rd
- 33393 Warwick Hills Rd
- 33345 Warwick Hills Rd
- 33364 Warwick Hills Rd
- 33370 Warwick Hills Rd
- 33376 Warwick Hills Rd
- 33384 Warwick Hills Rd
- 33356 Warwick Hills Rd
- 33337 Warwick Hills Rd
- 33401 Warwick Hills Rd
- 33392 Warwick Hills Rd
- 11837 Warwick Hills Ct
- 33398 Warwick Hills Rd
- 33409 Warwick Hills Rd
- 33329 Warwick Hills Rd
- 33387 Manning St
- 33375 Manning St