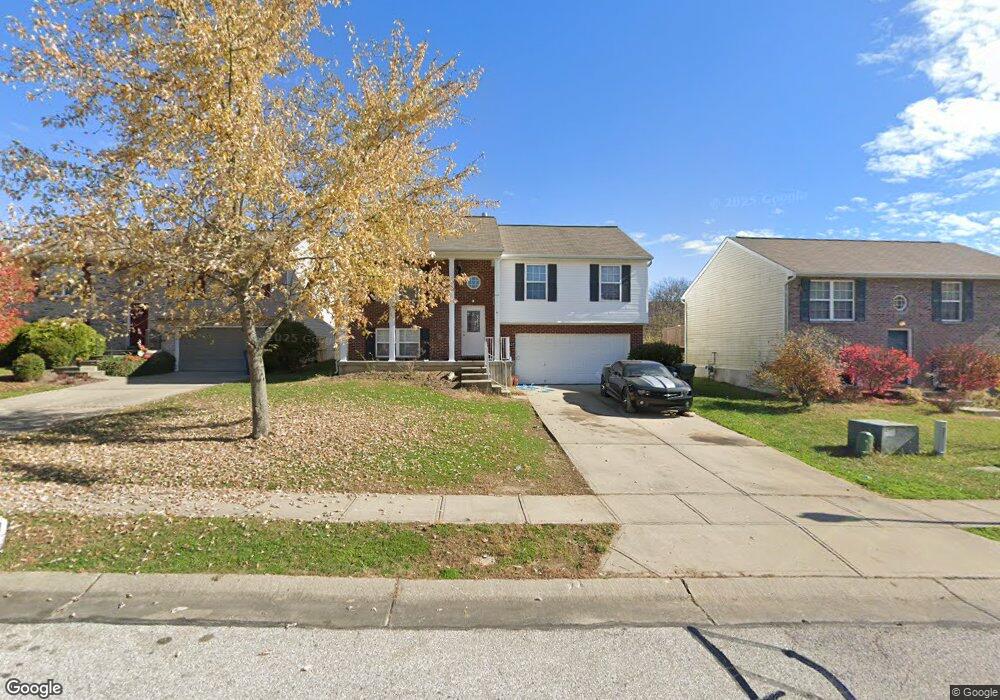
3337 Cedar Tree Ln Erlanger, KY 41018
Estimated Value: $220,000 - $258,000
3
Beds
3
Baths
1,147
Sq Ft
$215/Sq Ft
Est. Value
About This Home
This home is located at 3337 Cedar Tree Ln, Erlanger, KY 41018 and is currently estimated at $246,815, approximately $215 per square foot. 3337 Cedar Tree Ln is a home located in Kenton County with nearby schools including River Ridge Elementary School, Turkey Foot Middle School, and Dixie Heights High School.
Ownership History
Date
Name
Owned For
Owner Type
Purchase Details
Closed on
May 18, 2018
Sold by
Margronum Donald R and Margroum Victoria L
Bought by
Pujols Luis and Arbelawz Paola
Current Estimated Value
Purchase Details
Closed on
Sep 24, 2004
Sold by
Parkland Homes Inc
Bought by
Margroum Donald R and Margroum Victoria L
Home Financials for this Owner
Home Financials are based on the most recent Mortgage that was taken out on this home.
Original Mortgage
$109,840
Interest Rate
5.75%
Mortgage Type
Purchase Money Mortgage
Purchase Details
Closed on
Apr 19, 2004
Sold by
Afton Development Llc
Bought by
Parkland Homes Inc
Home Financials for this Owner
Home Financials are based on the most recent Mortgage that was taken out on this home.
Original Mortgage
$110,400
Interest Rate
6.24%
Mortgage Type
Construction
Create a Home Valuation Report for This Property
The Home Valuation Report is an in-depth analysis detailing your home's value as well as a comparison with similar homes in the area
Home Values in the Area
Average Home Value in this Area
Purchase History
| Date | Buyer | Sale Price | Title Company |
|---|---|---|---|
| Pujols Luis | $141,000 | American Homeland Title Agen | |
| Margroum Donald R | $137,300 | Prodigy Title Agency Llc | |
| Parkland Homes Inc | $29,000 | Kentucky Land Title Agency |
Source: Public Records
Mortgage History
| Date | Status | Borrower | Loan Amount |
|---|---|---|---|
| Previous Owner | Margroum Donald R | $109,840 | |
| Previous Owner | Parkland Homes Inc | $110,400 |
Source: Public Records
Tax History Compared to Growth
Tax History
| Year | Tax Paid | Tax Assessment Tax Assessment Total Assessment is a certain percentage of the fair market value that is determined by local assessors to be the total taxable value of land and additions on the property. | Land | Improvement |
|---|---|---|---|---|
| 2025 | $2,024 | $204,200 | $25,000 | $179,200 |
| 2024 | $2,093 | $204,200 | $25,000 | $179,200 |
| 2023 | $2,177 | $204,200 | $25,000 | $179,200 |
| 2022 | $1,584 | $141,000 | $25,000 | $116,000 |
| 2021 | $1,616 | $141,000 | $25,000 | $116,000 |
| 2020 | $1,633 | $141,000 | $25,000 | $116,000 |
| 2019 | $1,638 | $141,000 | $25,000 | $116,000 |
| 2018 | $1,610 | $138,100 | $30,000 | $108,100 |
| 2017 | $1,491 | $138,100 | $30,000 | $108,100 |
| 2015 | $1,450 | $138,100 | $30,000 | $108,100 |
| 2014 | $1,426 | $138,100 | $30,000 | $108,100 |
Source: Public Records
Map
Nearby Homes
- 3395 Cedar Tree Ln
- 3375 Fir Tree Ln
- 3213 Riggs Ave
- 437 Center St
- 3169 Birch Dr
- 3815 Hope Ln
- 419 Locust St
- 2474 Sierra Dr
- 403 Locust St
- Carrington Plan at Reserve at Meadowood - Designer Collection
- Mitchell Plan at Sanctuary Village - Masterpiece Collection
- Clay Plan at Sanctuary Village - Masterpiece Collection
- Leland Plan at Sanctuary Village - Masterpiece Collection
- Paxton Plan at Sanctuary Village - Masterpiece Collection
- Blair Plan at Reserve at Meadowood - Designer Collection
- Finley Plan at Sanctuary Village - Masterpiece Collection
- Grandin Plan at Reserve at Meadowood - Designer Collection
- Calvin Plan at Reserve at Meadowood - Designer Collection
- Rhodes Plan at Sanctuary Village - Masterpiece Collection
- Avery Plan at Reserve at Meadowood - Designer Collection
- 3339 Cedar Tree Ln
- 3335 Cedar Tree Ln
- 3341 Cedar Tree Ln
- 3333 Cedar Tree Ln
- 3343 Cedar Tree Ln
- 3331 Cedar Tree Ln
- 3348 Spruce Tree Ln
- 3345 Cedar Tree Ln
- 3340 Cedar Tree Ln
- 3334 Cedar Tree Ln
- 3330 Cedar Tree Ln
- 3347 Cedar Tree Ln
- 3332 Cedar Tree Ln
- 3342 Cedar Tree Ln
- 3352 Spruce Tree Ln
- 3344 Cedar Tree Ln
- 3351 Spruce Tree Ln
- 3333 Sycamore Tree Ln
- 3349 Cedar Tree Ln
- 3353 Spruce Tree Ln