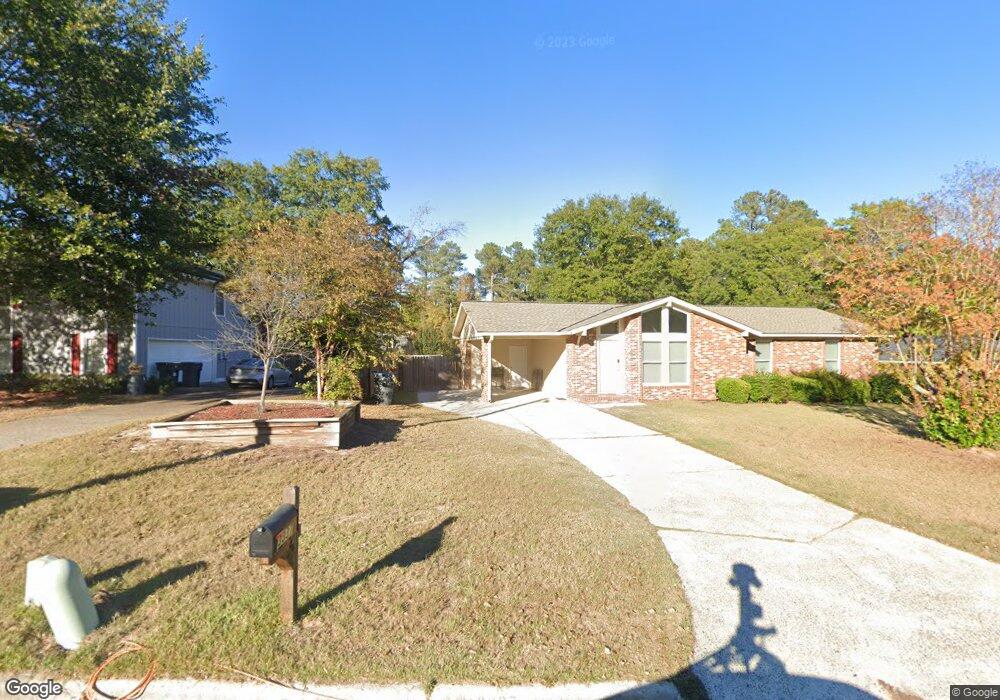
3339 Quaker Spring Rd Augusta, GA 30907
Montclair NeighborhoodEstimated Value: $279,642 - $292,000
4
Beds
3
Baths
2,192
Sq Ft
$131/Sq Ft
Est. Value
About This Home
This home is located at 3339 Quaker Spring Rd, Augusta, GA 30907 and is currently estimated at $286,911, approximately $130 per square foot. 3339 Quaker Spring Rd is a home located in Richmond County with nearby schools including Warren Road Elementary School, Tutt Middle School, and Johnson Magnet.
Ownership History
Date
Name
Owned For
Owner Type
Purchase Details
Closed on
May 27, 2004
Sold by
Duttweiler Robert
Bought by
Brackett Bret A and Brackett Charmain Z
Current Estimated Value
Home Financials for this Owner
Home Financials are based on the most recent Mortgage that was taken out on this home.
Original Mortgage
$140,987
Outstanding Balance
$66,398
Interest Rate
5.89%
Mortgage Type
Purchase Money Mortgage
Estimated Equity
$220,513
Purchase Details
Closed on
Aug 30, 1999
Sold by
Duguid Michael J and Duguid Laurie J
Bought by
Duttweiler Robert W
Home Financials for this Owner
Home Financials are based on the most recent Mortgage that was taken out on this home.
Original Mortgage
$62,000
Interest Rate
6.5%
Purchase Details
Closed on
Mar 30, 1995
Sold by
Estep James A
Bought by
Duguid Michael J
Purchase Details
Closed on
Sep 1, 1976
Create a Home Valuation Report for This Property
The Home Valuation Report is an in-depth analysis detailing your home's value as well as a comparison with similar homes in the area
Home Values in the Area
Average Home Value in this Area
Purchase History
| Date | Buyer | Sale Price | Title Company |
|---|---|---|---|
| Brackett Bret A | $143,200 | -- | |
| Duttweiler Robert W | $112,500 | -- | |
| Duguid Michael J | $106,900 | -- | |
| -- | $7,700 | -- |
Source: Public Records
Mortgage History
| Date | Status | Borrower | Loan Amount |
|---|---|---|---|
| Open | Brackett Bret A | $140,987 | |
| Previous Owner | Duttweiler Robert W | $62,000 |
Source: Public Records
Tax History
| Year | Tax Paid | Tax Assessment Tax Assessment Total Assessment is a certain percentage of the fair market value that is determined by local assessors to be the total taxable value of land and additions on the property. | Land | Improvement |
|---|---|---|---|---|
| 2025 | $3,221 | $107,384 | $12,800 | $94,584 |
| 2024 | $3,221 | $116,152 | $12,800 | $103,352 |
| 2023 | $2,345 | $100,192 | $12,800 | $87,392 |
| 2022 | $2,200 | $69,416 | $12,800 | $56,616 |
| 2021 | $2,276 | $66,196 | $12,800 | $53,396 |
| 2020 | $2,241 | $66,196 | $12,800 | $53,396 |
| 2019 | $2,146 | $59,097 | $11,600 | $47,497 |
| 2018 | $2,160 | $59,097 | $11,600 | $47,497 |
| 2017 | $2,106 | $59,097 | $11,600 | $47,497 |
| 2016 | $2,107 | $59,097 | $11,600 | $47,497 |
| 2015 | $2,122 | $59,097 | $11,600 | $47,497 |
| 2014 | $2,125 | $59,097 | $11,600 | $47,497 |
Source: Public Records
Map
Nearby Homes
- 3315 Sugar Mill Rd
- 2319 Creek View Dr
- 427 Shallowford Cir
- 429 Shallowford Cir
- 2915 Running Creek Ln
- 2928 Running Creek Ln
- 422 Pleasant Home Rd
- 3223 Crane Ferry Rd
- 306 Pleasant Home Rd
- 3310 Sandpiper Ln
- 33 Londonberry Ln
- 2944 Foxhall Cir
- 306 Skylark Rd
- 203 Buckhead Ct
- 3323 Ravenwood Dr
- 333 Indian Trail
- 3319 Thread Needle Rd W
- 3322 Sandpiper Ln
- 221 Simmons Ct
- 2921 Foxhall Cir
- 3339 Quaker Spring Rd
- 3341 Quaker Spring Rd
- 3337 Quaker Spring Rd
- 2904 Pleasant Cove Ct
- 2906 Pleasant Cove Ct
- 3335 Quaker Spring Rd
- 3343 Quaker Spring Rd
- 3340 Quaker Spring Rd
- 2902 Pleasant Cove Ct
- 3342 Quaker Spring Rd
- 3338 Quaker Spring Rd
- 3336 Quaker Spring Rd
- 2903 Pleasant Cove Ct
- 3333 Quaker Springs Rd
- 3333 Quaker Spring Rd
- 2905 Pleasant Cove Ct
- 3344 Quaker Spring Rd
- 3345 Quaker Spring Rd
- 2901 Pleasant Cove Ct
- 403 Shallowford Cir
Your Personal Tour Guide
Ask me questions while you tour the home.