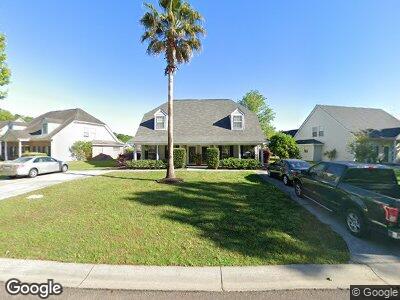
3339 Queensgate Way Mount Pleasant, SC 29466
Park West NeighborhoodEstimated Value: $402,000 - $421,000
3
Beds
2
Baths
1,390
Sq Ft
$297/Sq Ft
Est. Value
About This Home
This home is located at 3339 Queensgate Way, Mount Pleasant, SC 29466 and is currently estimated at $413,467, approximately $297 per square foot. 3339 Queensgate Way is a home located in Charleston County with nearby schools including Charles Pinckney Elementary School, Laurel Hill Primary School, and Thomas C. Cario Middle School.
Ownership History
Date
Name
Owned For
Owner Type
Purchase Details
Closed on
Mar 13, 2013
Sold by
Whitney Paul Alan
Bought by
Whitney Patsy R
Current Estimated Value
Home Financials for this Owner
Home Financials are based on the most recent Mortgage that was taken out on this home.
Original Mortgage
$149,700
Interest Rate
3.65%
Mortgage Type
New Conventional
Purchase Details
Closed on
Nov 30, 2009
Sold by
Whitney Brian Dean and Morrow Peggy A
Bought by
Whitney Patsy R
Purchase Details
Closed on
Nov 23, 2009
Sold by
Estate Of Prosper King Whitney Iv and Whitney Patsy R
Bought by
Whitney Patsy R and Whitney Brian Dean
Purchase Details
Closed on
Nov 2, 2009
Sold by
Estate Of Prosper King Whitney Iv and Whitney Patsy R
Bought by
Whitney Patsy R and Whitney Brian Dean
Purchase Details
Closed on
Apr 25, 2003
Sold by
Stlaurent Fred W
Bought by
Whitney Prosper K and Whitney Patsy R
Purchase Details
Closed on
Mar 31, 2000
Sold by
Winston Carlyle & Company Park West Llc
Bought by
Stlaurent Fred W
Create a Home Valuation Report for This Property
The Home Valuation Report is an in-depth analysis detailing your home's value as well as a comparison with similar homes in the area
Home Values in the Area
Average Home Value in this Area
Purchase History
| Date | Buyer | Sale Price | Title Company |
|---|---|---|---|
| Whitney Patsy R | -- | -- | |
| Whitney Patsy R | -- | -- | |
| Whitney Patsy R | -- | -- | |
| Whitney Patsy R | -- | -- | |
| Whitney Patsy R | -- | -- | |
| Whitney Prosper K | $130,000 | -- | |
| Stlaurent Fred W | $113,990 | -- |
Source: Public Records
Mortgage History
| Date | Status | Borrower | Loan Amount |
|---|---|---|---|
| Open | Whitney Patsy R | $170,000 | |
| Closed | Whitney Patsy R | $149,700 |
Source: Public Records
Tax History Compared to Growth
Tax History
| Year | Tax Paid | Tax Assessment Tax Assessment Total Assessment is a certain percentage of the fair market value that is determined by local assessors to be the total taxable value of land and additions on the property. | Land | Improvement |
|---|---|---|---|---|
| 2023 | $715 | $5,420 | $0 | $0 |
| 2022 | $619 | $5,420 | $0 | $0 |
| 2021 | $668 | $5,420 | $0 | $0 |
| 2020 | $686 | $5,420 | $0 | $0 |
| 2019 | $588 | $4,450 | $0 | $0 |
| 2017 | $581 | $6,450 | $0 | $0 |
| 2016 | $559 | $6,450 | $0 | $0 |
| 2015 | $579 | $6,450 | $0 | $0 |
| 2014 | $556 | $0 | $0 | $0 |
| 2011 | -- | $0 | $0 | $0 |
Source: Public Records
Map
Nearby Homes
- 3084 Queensgate Way
- 1529 Wellesley Cir
- 3447 Toomer Kiln Cir
- 1678 William Hapton Way
- 2004 Hammond Dr
- 1704 Tolbert Way
- 2136 Baldwin Park Dr
- 3199 Sonja Way
- 1485 Endicot Way
- 1428 Bloomingdale Ln
- 1736 James Basford Place
- 3336 Toomer Kiln Cir
- 1409 Endicot Way
- 2014 Basildon Rd Unit 2014
- 1733 James Basford Place
- 2690 Park Blvd W
- 1610 Mermentau St
- 1828 S James Gregarie Rd
- 1908 Basildon Rd Unit 1908
- 1458 Clarendon Way
- 3339 Queensgate Way
- 3347 Queensgate Way
- 3331 Queensgate Way
- 3323 Queensgate Way
- 3355 Queensgate Way
- 3351 Queensgate Way
- 3319 Queensgate Way
- 3359 Queensgate Way
- 3311 Queensgate Way
- 1692 Baltusrol Ln
- 1688 Baltusrol Ln
- 3344 Queensgate Way
- 3340 Queensgate Way
- 3348 Queensgate Way
- 3336 Queensgate Way
- 3303 Queensgate Way
- 3307 Queensgate Way
- 3332 Queensgate Way
- 1680 Baltusrol Ln
- 3324 Queensgate Way